Understanding the Three Core Profit Margins
 Profit margins are the most direct indicators of a company’s financial health. By breaking down the income statement into three distinct margins—gross, operating, and net—you can see exactly where value is created and where costs are eroding it.
1. Gross Profit Margin
The gross profit margin measures the efficiency of production or service delivery. It answers the question: *How much of each sales dollar remains after covering the cost of goods sold (COGS)?*
- Formula:
Gross Profit Margin = (Revenue – Refunds & Allowances – COGS) ÷ Revenue × 100% - Typical benchmark: 20‑40% for retail, 30‑60% for manufacturing, 70‑90% for software SaaS companies.
2. Operating Profit Margin
Operating profit (also called EBIT margin) reflects the profitability of core operations before interest and taxes. It shows how well the business controls its operating expenses.
- Formula:
Operating Profit Margin = (Gross Profit – Operating Expenses) ÷ Revenue × 100% - Typical benchmark: 5‑15% for most service businesses, 10‑20% for manufacturing, 15‑30% for technology firms.
3. Net Profit Margin
The net profit margin is the bottom‑line measure that includes all costs—operating, interest, taxes, and any extraordinary items.
- Formula:
Net Profit Margin = (Operating Profit – Taxes – Other Expenses) ÷ Revenue × 100% - Typical benchmark: 2‑8% for most small‑to‑mid‑size businesses, 10‑20% for high‑margin enterprises.
Why Tracking Profit Margins Matters
Monitoring each margin over time gives you a clear, actionable view of performance:
- Identify cost‑driving issues before they hurt the bottom line.
- Compare your ratios with industry peers for competitive benchmarking.
- Spot trends—improving or deteriorating margins—across months, quarters, or years.
- Enable realistic break‑even and scenario analysis.
Industry‑Specific Examples
Retail
Retailers often have low gross margins (15‑30%) because of high inventory turnover. Focus on reducing shrinkage and improving supplier terms to lift operating profit.
Manufacturing
Manufacturers enjoy higher gross margins (30‑50%) but may face heavy overhead. Streamlining production processes can raise operating margins significantly.
Software SaaS
SaaS firms typically post very high gross margins (70‑90%) because the cost of delivering an additional subscription is minimal. The key driver becomes operating efficiency—sales, marketing, and R&D spend.
Building a Profit‑Margin Dashboard in Excel
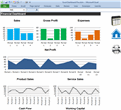
Automating margin calculations saves time and ensures consistency. Use an Excel template that pulls data directly from your income statement and visualizes each margin with sparklines and conditional formatting. A ready‑made solution is available in our Automated Excel Financials product.
Quick Profit‑Margin Checklist
| Step | Action | Tool/Resource |
|---|---|---|
| 1 | Extract revenue, refunds, COGS, operating expenses, taxes from the latest Income Statement. | Financial Statements Templates (download) |
| 2 | Calculate each margin using the formulas above. | Excel profit‑margin calculator (built‑in) |
| 3 | Plot the three margins on a line chart for the last 12 periods. | Automated Excel Financials |
| 4 | Compare results to industry benchmarks. | Finance‑Profit‑Growth Toolkit (access) |
| 5 | Identify any margin that deviates more than 2% from the trend and investigate root causes. | Action‑item worksheet (included in the toolkit) |
Next Steps for Better Profitability
Once you have clean, visual margin data, you can:
- Run break‑even scenarios to see how volume changes affect each margin.
- Perform “what‑if” analysis on price changes, cost reductions, or new product launches.
- Set realistic margin improvement targets for the next quarter.
Ready to accelerate your profit‑margin insights? Grab the Finance Profit Growth Toolkit and get templates, dashboards, and step‑by‑step guides that turn raw numbers into actionable strategies.


