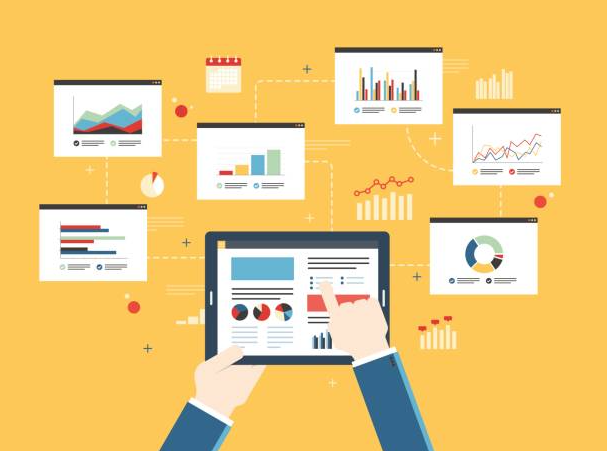
The Science of Data Interpretation: Making Sense of Excel Reports

The Science of Data Interpretation: Making Sense of Excel Reports

Unleashing the Power of Data: A Comprehensive Guide to Excel Reports In today’s data-driven world, Excel reports are essential tools for turning raw numbers into meaningful insights. They empower professionals and businesses to make data-informed decisions and uncover trends that drive growth. This guide explores the science behind interpreting Excel reports—helping you unlock their full … Read more

Business Charts and Graphs Examples

Business Charts and Graphs Examples

As business professionals, we’re continually searching for effective methods to streamline workflows, enhance productivity, and uncover insights that drive informed decisions. Utilizing charts and graphs in Excel is a powerful way to improve reporting and presentations, equipping us with the business insights needed for strategic decision-making. Given the increasing volume of data, leveraging the right … Read more

How to Create Whale Curve in Excel: Free Excel Template Download

How to Create Whale Curve in Excel: Free Excel Template Download

Introducing the Whale Curve: A Powerful Tool for Visualizing Customer Profitability Are you overwhelmed by customer data and struggling to pinpoint who your most profitable clients are? The Whale Curve is an invaluable chart that enables you to visualize customer profitability and make informed decisions based on data. What is the Whale Curve? The Whale … Read more

Best Excel Charts for Your Dashboard: A Comprehensive Guide

Best Excel Charts for Your Dashboard: A Comprehensive Guide

Presenting raw data in its native form can be overwhelming and often obscures insights. Instead, leveraging the right Excel charts transforms data into clear, actionable visuals. Well-chosen charts help you identify trends, uncover patterns, and explore relationships that might stay hidden in spreadsheets. This makes your dashboards not only more appealing but also more powerful … Read more

Creating a Dashboard in Excel: Step-by-Step Guide for Business Managers

Creating a Dashboard in Excel: Step-by-Step Guide for Business Managers

Table of Contents Introduction: Why Excel Dashboards Matter for Business Step 1: Plan Your Excel Dashboard Step 2: Prepare Your Data Step 3: Create Data Visualizations Step 4: Build the Dashboard Layout Step 5: Add Interactive Elements Step 6: Connect Data with Formulas and Functions Industry-Specific Examples Conclusion: Key Takeaways Introduction: Why Excel Dashboards Matter … Read more

Why Using Data Visualization for Tracking KPIs?

Why Using Data Visualization for Tracking KPIs? Tracking Key Performance Indicators (KPIs) is essential for businesses aiming to stay competitive and agile. Organizations that can collect data efficiently and analyze it quickly often outpace their competitors by making informed decisions faster. Data visualization transforms complex information into clear, visual formats that enable immediate insight into … Read more