Understanding the Sales Report Format in Excel
A sales report is a vital document for any business. It enables organizations to track sales performance over a specific period. By analyzing sales data, you can identify trends, evaluate your sales team’s effectiveness, and make informed strategic decisions to increase revenue.
For instance, if analysis reveals that sales consistently peak between June and September, businesses can prepare by increasing inventory, scheduling more labor, and allocating resources accordingly during those months to maximize opportunities.
Why Use Excel for Sales Reporting?
Excel is a robust tool widely used by professionals for data management and reporting. Creating a sales report in Excel can streamline your workflow with automation features, formulas, and easy visualization tools. Whether you are a beginner or an advanced user, Excel offers flexibility to build simple or complex sales reports tailored to your needs.
Building a Simple Sales Report Format in Excel: Step-by-Step Guide
Follow these steps to create a practical one-week sales report, which you can adapt for longer periods and different types of sales data.
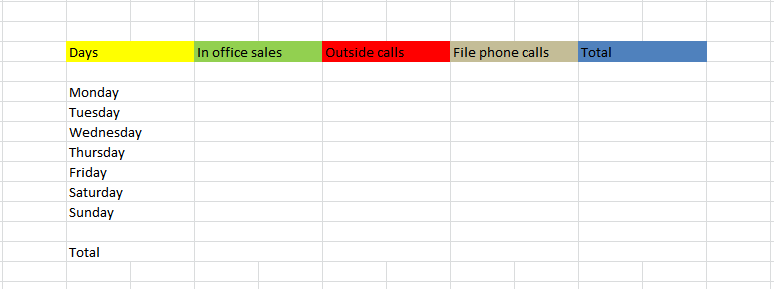
Step 1: Set Up the Main Columns
- Days: List the days of the reporting period.
- In-Office Sales: Sales made within your office or store.
- Outside Calls: Sales generated from client visits or field calls.
- File Phone Calls: Sales completed via phone.
- Total: The sum of sales from all channels.
Step 2: Organize the Days Column
Under the Days column, create sub-columns for each day of the week (e.g., Monday through Sunday), plus an additional sub-column for weekly totals.
Step 3: Use AutoSum Formulas for Totals
- Calculate daily totals by summing sales across different channels for each day.
- Add a total row to sum up the sales for each column, giving overall in-office sales, outside calls, and phone sales totals for the week.
- Excel’s AutoSum feature makes this process quick and error-free.
Step 4: Visualize Data with Excel Charts
Enhance your sales report by adding charts for better visualization:
- Select the relevant sales data.
- Go to the Insert tab and choose chart types such as Line, Column, or Pie charts depending on the data and purpose.
- Well-designed charts can highlight trends and support faster decision-making.
Advanced Tips for an Enhanced Sales Report Format in Excel
- Use Conditional Formatting: Highlight high and low sales figures automatically for easy identification.
- Implement PivotTables: Summarize large sales datasets dynamically.
- Include Monthly and Quarterly Views: Build multiple sheets for different time periods to track performance.
- Incorporate Forecasting: Use Excel’s forecasting tools to predict future sales trends.
- Automate Data Import: Connect your sales software data to Excel for real-time updates.
Industry-Specific Sales Report Examples
Different industries may require unique sales reporting formats to capture specifics relevant to their operations. Here are quick examples:
Retail Sales Report Format
- Product categories
- Daily sales per product
- Discounts applied
- Returns and exchanges
- Store location performance
B2B Sales Report Format
- Client name and contact
- Order size and frequency
- Sales pipeline stages
- Lead source tracking
- Sales rep performance metrics
Service-Based Sales Report Format
- Projects or contract names
- Billable hours and rates
- Completed vs pending contracts
- Client satisfaction ratings
- Revenue by service type
Sales Report Format Implementation Tool: Weekly Sales Tracker Example
| Day | In-Office Sales | Outside Calls | Phone Sales | Total |
|---|---|---|---|---|
| Monday | 500 | 300 | 200 | =SUM(B2:D2) |
| Tuesday | 450 | 350 | 180 | =SUM(B3:D3) |
| Wednesday | 600 | 320 | 210 | =SUM(B4:D4) |
| Thursday | 580 | 400 | 190 | =SUM(B5:D5) |
| Friday | 620 | 370 | 220 | =SUM(B6:D6) |
| Saturday | 530 | 290 | 230 | =SUM(B7:D7) |
| Sunday | 480 | 310 | 205 | =SUM(B8:D8) |
| Total | =SUM(B2:B8) | =SUM(C2:C8) | =SUM(D2:D8) | =SUM(E2:E8) |
Note: Replace sample sales numbers with your actual data. Use Excel’s AutoSum feature for the ‘Total’ cells for automatic calculations.
Maximize Your Sales Reporting with Templates and Tools
For more comprehensive and automated solutions, consider utilizing pre-built Excel templates designed for sales and financial reporting. These templates save time and offer enhanced functionalities such as dashboards, advanced formulas, and integration capabilities.
Explore resources like Automated Excel Reporting and Financial Dashboard Excel to take your sales reports to the next level and gain deeper insights into your business performance.


