Unlock the power of sales dashboards for multi-location operations with our expert guide. Discover best practices, actionable templates, and strategies to streamline data, boost performance, and drive growth across all your locations.
Managing sales across multiple locations is no small feat. With disparate teams, varying market conditions, and a flood of data, it’s easy to lose sight of the big picture. Enter sales dashboards—your ultimate tool for consolidating insights, tracking performance, and making data-driven decisions. In this guide, we’ll explore the best practices for designing sales dashboards tailored to multi-location operations, along with actionable templates to get you started.
Why Sales Dashboards Matter for Multi-Location Operations
Sales dashboards are more than just visual reports; they’re dynamic tools that transform raw data into actionable insights. For multi-location businesses, they offer:
- Centralized Visibility: Monitor performance across all locations in real-time.
- Data-Driven Decisions: Identify trends, bottlenecks, and opportunities at a glance.
- Consistency: Standardize metrics and KPIs across locations to ensure alignment.
- Scalability: Adapt to growth by adding new locations without overwhelming your analytics.
Without a robust dashboard, you risk relying on fragmented data, delayed reporting, and inconsistent performance tracking—all of which can hinder growth.
Best Practices for Designing Multi-Location Sales Dashboards
1. Define Clear Objectives
Before diving into design, ask: What do we want to achieve with this dashboard? Common objectives for multi-location operations include:
- Tracking sales performance by location.
- Monitoring inventory levels across stores.
- Comparing regional sales trends.
- Identifying top-performing teams or products.
Clear objectives ensure your dashboard focuses on the metrics that matter most.
2. Choose the Right KPIs
Key Performance Indicators (KPIs) are the backbone of your dashboard. For multi-location operations, consider metrics like:
- Revenue by Location: Total sales generated per store or region.
- Average Transaction Value (ATV): Revenue per transaction, segmented by location.
- Sales Growth Rate: Month-over-month or year-over-year growth by location.
- Customer Acquisition Cost (CAC): Cost to acquire a new customer, broken down by region.
- Inventory Turnover: How quickly stock is sold and replaced across locations.
Tailor your KPIs to reflect the unique needs of each location while maintaining consistency across the board.
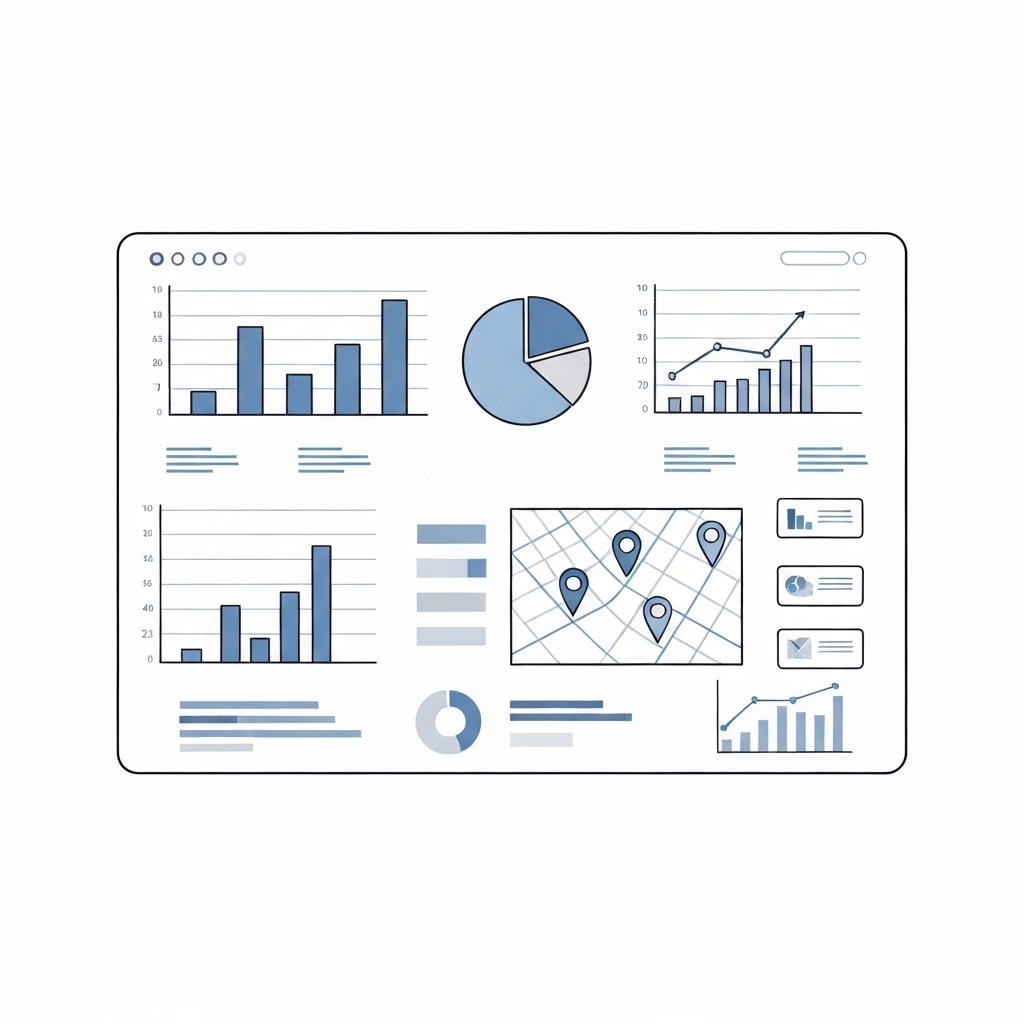
3. Prioritize Visual Clarity
A cluttered dashboard defeats its purpose. Use these design principles to ensure clarity:
- Minimalism: Stick to essential metrics and avoid overloading with data.
- Color Coding: Use colors to differentiate locations or highlight trends.
- Interactive Elements: Allow users to drill down into specific locations or time periods.
- Mobile-Friendly Design: Ensure the dashboard is accessible on all devices for on-the-go insights.
4. Incorporate Geographic Data
For multi-location operations, maps are a game-changer. Visualize sales data on a map to:
- Compare performance across regions.
- Identify high-performing and underperforming locations.
- Spot geographic trends, such as seasonal fluctuations or market saturation.
5. Automate Data Updates
Manual data entry is time-consuming and error-prone. Integrate your dashboard with CRM, ERP, or POS systems to ensure real-time updates. Automation not only saves time but also provides accurate, up-to-date insights.
6. Segment Data for Granular Insights
Multi-location operations require both high-level and granular views. Segment data by:
- Location: Compare performance across stores or regions.
- Product: Identify top-selling items by location.
- Time Period: Analyze daily, weekly, or monthly trends.
Segmentation helps you uncover patterns and make informed decisions.
7. Include Actionable Insights
A dashboard isn’t just for monitoring—it’s for driving action. Include recommendations or alerts, such as:
- Low inventory warnings for specific locations.
- Sales targets vs. actual performance.
- Suggestions for reallocating resources based on regional demand.
Templates for Multi-Location Sales Dashboards
Ready to build your dashboard? Here are three templates to inspire your design:
Template 1: Regional Sales Overview
Purpose: Track sales performance across regions.
Key Metrics:
- Revenue by Region (Bar Chart)
- Sales Growth Rate (Line Graph)
- Top 5 Performing Locations (Table)
Visuals: Interactive map with color-coded regions.
Template 2: Location-Specific Performance
Purpose: Dive deep into individual location performance.
Key Metrics:
- Daily Sales (Line Graph)
- Average Transaction Value (Gauge Chart)
- Inventory Levels (Bar Chart)
Visuals: Dropdown menu to select specific locations.
Template 3: Product Performance by Location
Purpose: Analyze product sales across locations.
Key Metrics:
- Top-Selling Products by Location (Heatmap)
- Product Sales Trends (Line Graph)
- Inventory Turnover (Table)
Visuals: Filter by product category or location.
Tools to Build Your Sales Dashboard
Creating a sales dashboard doesn’t require coding skills—thanks to user-friendly tools like:
- Tableau: Powerful data visualization with advanced analytics.
- Power BI: Seamless integration with Microsoft tools.
- Google Data Studio: Free and easy to use for small businesses.
- Looker: Ideal for large enterprises with complex data needs.
Common Pitfalls to Avoid
- Overloading with Metrics: Stick to 5-10 key metrics to avoid information overload.
- Ignoring User Needs: Involve stakeholders in the design process to ensure the dashboard meets their needs.
- Neglecting Mobile Optimization: Ensure the dashboard is accessible on all devices.
- Failing to Update Data: Automate data updates to maintain accuracy.
Final Thoughts
Sales dashboards are indispensable for multi-location operations. By centralizing data, visualizing insights, and driving actionable decisions, they empower businesses to optimize performance and fuel growth. Follow the best practices and templates outlined in this guide to create a dashboard that transforms your sales strategy.


