Why Safety KPIs Matter Now
Today’s workforce expects a safe, supportive environment. When safety is measurable, managers can prove that they protect people, lower costs, and keep talent from jumping to a competitor. A well‑designed safety key performance indicator (KPI) turns vague “stay safe” promises into data‑driven actions.
What Is a Safety KPI?
A safety KPI is a quantifiable metric that monitors how well an organization prevents workplace injuries, illnesses, and near‑miss events. It lets you:
- Detect problem areas before an incident escalates
- Allocate safety resources more efficiently
- Communicate safety performance to employees, leadership, and regulators
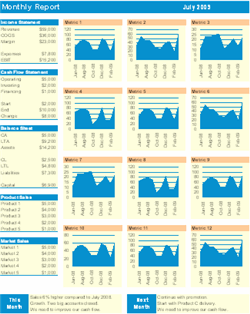
Using a dashboard (like an Excel safety‑metrics dashboard) makes the numbers instantly visible and actionable.
Core Safety KPI Examples
Below are the most common, high‑impact safety indicators that work across industries.
- Overall Incident Rate (OIR) – Total recordable incidents per 100 full‑time employees.
- Lost‑Time Injury Frequency Rate (LTIFR) – Number of injuries that caused missed work days per million hours worked.
- Number of Non‑Critical Accidents – Minor slips, trips, or cuts that required no lost time.
- Near‑Miss Reporting Rate – Frequency of reported incidents that could have become injuries.
- Safety Training Hours – Total hours of mandatory safety training per employee.
- Monthly Safety Prevention Cost – Money spent on safety equipment, inspections, and preventive programs.
Industry‑Specific Safety KPIs
Construction
- Tool‑box Talk Attendance Rate
- Fall‑Related Incident Rate
- Equipment Inspection Compliance %
Manufacturing
- Machine Guarding Violation Count
- Lockout/Tagout (LOTO) Completion Rate
- Ergonomic Injury Frequency
Healthcare
- Needle‑Stick Injuries per 1,000 Hours
- Patient Handling Incident Rate
- Infection Control Compliance %
How to Build a Safety KPI Dashboard
Follow these five steps to get a live, actionable dashboard up and running.
- Define the Goal – What safety outcome are you trying to improve? (e.g., reduce LTIFR by 20% in 12 months.)
- Select Relevant KPIs – Choose metrics that directly influence the goal.
- Gather Data Sources – Pull incident reports, HR training logs, and equipment inspection records into a single spreadsheet.
- Design Visuals – Use simple charts (trend lines, bar charts) and conditional formatting to highlight thresholds.
- Review & Act – Schedule monthly safety reviews, assign owners, and update actions based on the dashboard.
Need a ready‑made template? Check out the Balanced Scorecard and Strategy Map Toolkit – it includes a safety‑KPI worksheet that plugs straight into Excel.
Practical Tools & Templates
Below is a quick‑start checklist you can copy into your own workbook.
| Step | Action Item | Owner | Due Date |
|---|---|---|---|
| 1 | Agree on top 3 safety goals with senior leadership | Safety Manager | MM/DD/2025 |
| 2 | Map data sources (incident log, training records, equipment inspections) | HR & Ops Leads | MM/DD/2025 |
| 3 | Build Excel dashboard using pre‑formatted templates | BI Analyst | MM/DD/2025 |
| 4 | Schedule monthly safety review meeting | Operations Manager | First Monday of each month |
| 5 | Update action plan based on KPI trends | Safety Team | Ongoing |
Additional Resources for Safety‑Focused Professionals
Expand your safety toolbox with these quick‑read guides:
- 101 Ways to Attract & Keep Top Talent – shows how a strong safety culture boosts recruitment.
- 101 Ways to Save Time & Automate Workflows – learn how to automate incident‑report collection.
- Automated Excel Reporting – turn raw safety data into live dashboards without manual updates.
Start Measuring Safety Today
Implementing safety KPIs doesn’t have to be complex. Choose three key metrics, plug them into an Excel dashboard, and review the results each month. The data will reveal hidden risks, guide training investments, and demonstrate to your team that safety is a measurable priority.
Ready to jump‑start your safety performance tracking? Explore the Balanced Scorecard and Strategy Map Toolkit for ready‑made KPI templates, visual guides, and step‑by‑step instructions.


