Executive Summary
Real-time supplier performance dashboards provide instant visibility into critical supply chain metrics. These tools reduce operational risks, improve negotiation leverage, and create 23% faster issue resolution according to Gartner research. By tracking KPIs like on-time delivery rates and quality compliance scores, businesses gain actionable insights to optimize procurement strategies.
What Is a Supplier Performance Dashboard?
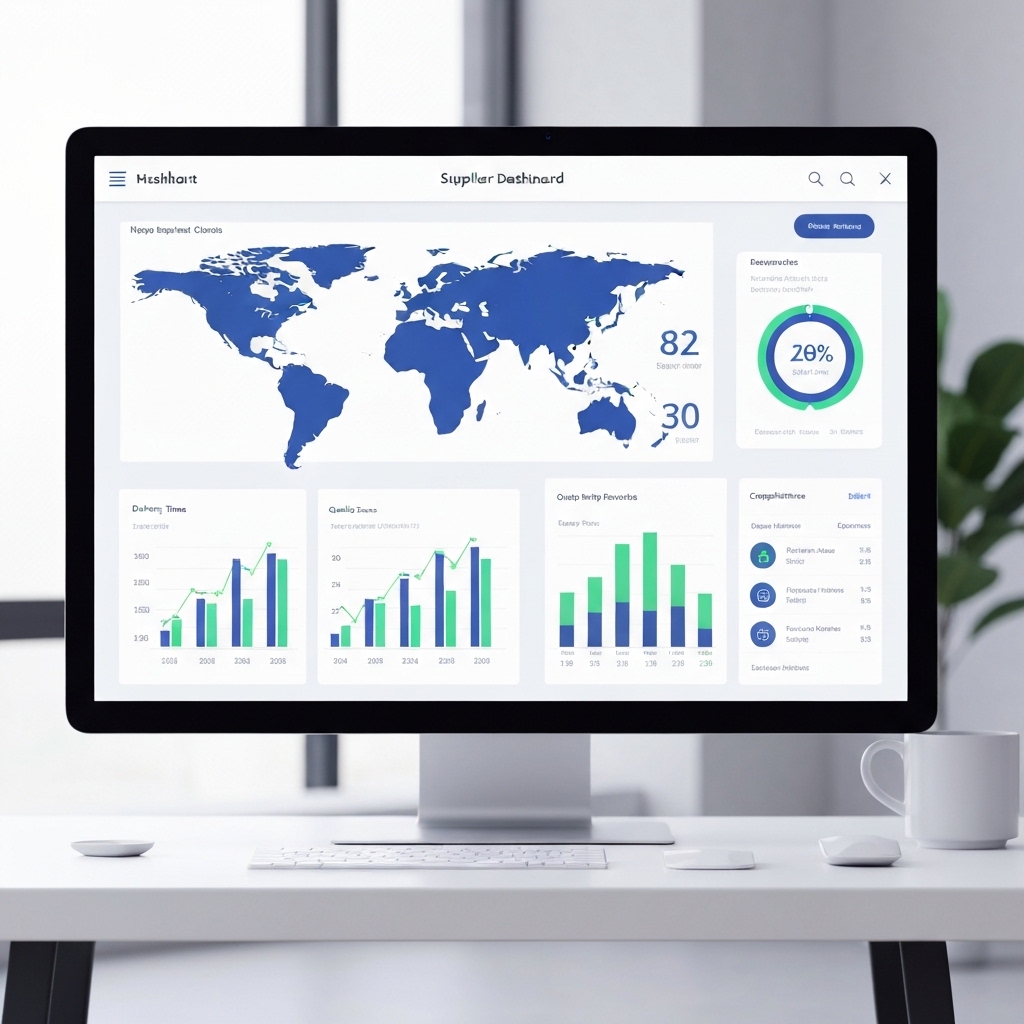
A supplier performance dashboard is a centralized visualization tool that tracks key metrics across your supply chain. Unlike traditional monthly reports, real-time systems update metrics every 15-30 minutes through automated data feeds from ERP systems, shipping logs, and quality control databases.
Core components include:
- Live delivery status maps
- Quality inspection scorecards
- Payment compliance timelines
- Inventory replenishment alerts
5 Critical Supplier KPIs to Track
Focus on metrics that directly impact your bottom line:
- On-Time Delivery Rate – Calculate as (Delivered On-Time Orders / Total Orders) × 100
- Quality Compliance Score – Measure % of shipments meeting specifications
- Lead Time Variability – Track average vs actual delivery windows
- Cost Deviation – Compare quoted vs actual pricing per unit
- Response Time – Measure supplier reaction time to issues
Three Immediate Benefits of Real-Time Visibility
Transparency: Identify bottlenecks before they become crises. For example, a sudden 15% drop in a supplier’s quality score triggers immediate investigation.
Negotiation Power: Data-backed discussions increase contract leverage. One automotive manufacturer secured 8% cost reductions using historical performance reports.
Risk Mitigation: Early warning systems reduce stockouts by 40% through predictive inventory alerts.
How to Implement a Supplier Dashboard
Step 1: Map Your Supply Chain
Create a tiered visualization showing primary suppliers, sub-tier vendors, and logistics partners. Include geographic locations and critical path dependencies.
Step 2: Select Measurement Tools
Choose between:
- Cloud-based platforms like Power BI or Tableau
- Custom-built solutions using Python/Dash
- ERP-integrated modules (SAP, Oracle)
Step 3: Establish Alert Thresholds
Set automatic notifications for metric deviations. Example: Email alert when delivery delays exceed 5% of scheduled shipments.
Case Study: Manufacturing Sector Success
A global electronics manufacturer implemented real-time tracking for 200+ suppliers. Results within 6 months:
- Supplier defect rates dropped 18%
- Procurement cycle time reduced from 14 to 9 days
- Annual cost savings: $2.3M through data-driven negotiations
Common Implementation Challenges
Data Silos: 65% of companies struggle with integrating multiple source systems. Solution: Use middleware platforms like Zapier or MuleSoft.
Supplier Resistance: Start with voluntary pilot programs. Offer dashboard access to top-tier suppliers as a value-add.
Over-Measurement: Focus on 5-7 high-impact metrics. Avoid tracking “nice-to-have” data that complicates analysis.
Action Plan for Immediate Results
Today: List your top 10 suppliers and identify 2 critical KPIs for each.
This Week: Audit existing data sources and map integration requirements.
This Month: Implement a dashboard prototype tracking 3 core metrics.
Key Takeaways
Real-time supplier visibility isn’t just technology – it’s a strategic advantage. By making performance data actionable, companies reduce costs, improve quality, and build stronger vendor relationships. Start small, prove value quickly, then scale across your supply network.
Remember: The goal isn’t perfect data, but faster decision-making. Even 80% accurate real-time information beats 100% perfect data that arrives too late.


