What You’re Seeing – A Quick Overview
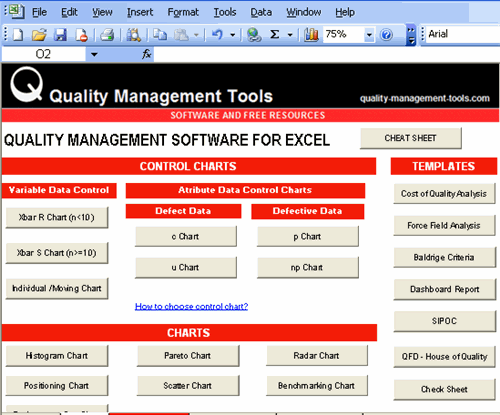
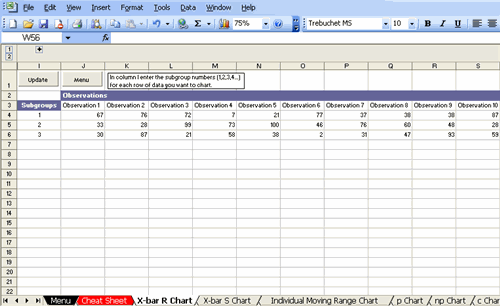
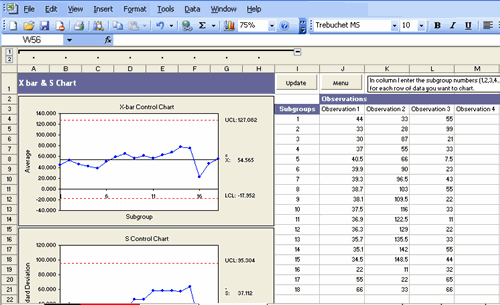
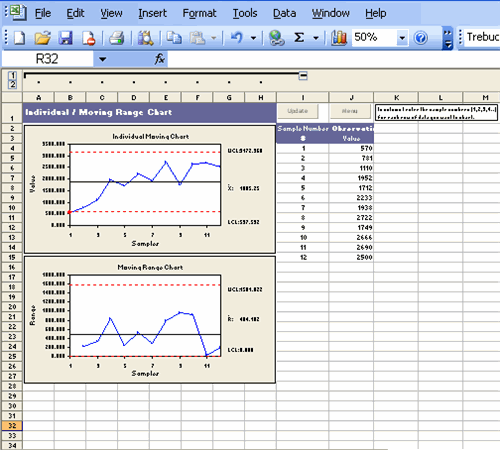
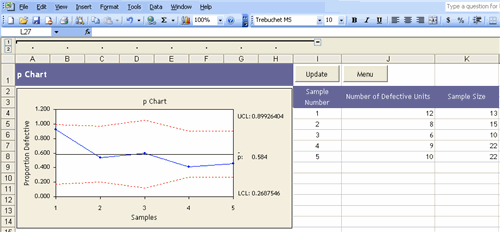
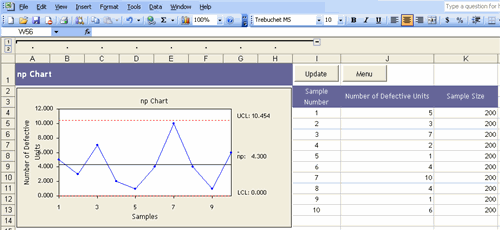
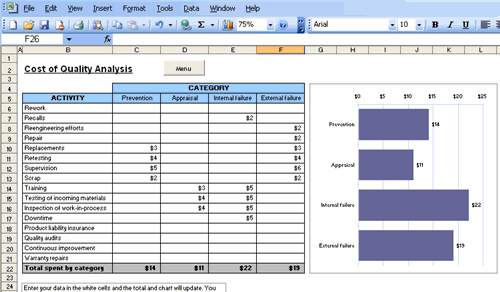
The collection of animated screenshots below shows the core screens of our quality‑management dashboard. Each GIF captures a live view of the tool in action – from data entry to visual analytics.
Why Quality Management Tools Are Essential for Modern Businesses
In today’s data‑driven environment, businesses need a single place to capture defects, monitor key performance indicators (KPIs) and turn insights into corrective actions. A well‑designed tool helps you:
- Standardize processes across teams, reducing variation.
- Identify root causes quickly with visual analytics.
- Track improvement projects from initiation to closure.
- Report compliance to auditors and senior leadership.
Key Features Highlighted in the Screenshots
1. Real‑time KPI Dashboard
The first screen displays a live KPI meter (e.g., defect rate, cycle time). Filters let you drill down by product line, date range or department.
2. Process Mapping & Flowcharts
Visual process maps make it easy to see where bottlenecks occur. Click‑through nodes to view associated metrics.
3. Root‑Cause Analysis Grid
A matrix links symptoms to probable causes, using the 5‑Why technique. The grid auto‑highlights the most frequent drivers.
4. Action‑Item Tracker
Every corrective action gets a due date, owner, and status badge. Integrated email alerts keep owners accountable.
5. Trend & Forecast Charts
Historical data is plotted on sparkline charts, helping you forecast future quality performance.
How to Implement These Screens in Your Own Organization
Follow this simple three‑step recipe to get started:
- Import your data. Export a CSV from your ERP or quality log and upload it via the Data Import tab.
- Configure KPIs. Choose the metrics most relevant to your industry – see the Financial Dashboard Excel guide for examples of financial‑quality linkages.
- Run the dashboard. Use the live view to monitor, analyze, and assign corrective actions. Export reports for monthly board meetings.
Industry‑Specific Examples
Manufacturing
- Track defect rates per production line.
- Map first‑pass yield against equipment downtime.
Professional Services
- Measure client‑issue resolution time.
- Use the root‑cause grid to improve project hand‑off quality.
Quick‑Start Quality Management Checklist
| Task | Owner | Due Date | Status |
|---|---|---|---|
| Gather last 12 months of defect data | Quality Analyst | [Date] | Pending |
| Define top‑3 KPIs (e.g., DPMO, Cycle Time) | Operations Manager | [Date] | In Progress |
| Set up dashboard filters and alerts | IT / System Admin | [Date] | Not Started |
Take the Next Step
Ready to embed a full‑featured quality‑management suite into your daily workflow? Discover the Balanced Scorecard and Strategy Map Toolkit – a proven framework that aligns your quality metrics with overall business strategy.
Explore additional resources that complement quality management:
- 101 Ways to Boost Customer Retention & Loyalty
- 101 Ways to Save Time & Automate Workflows
- Financial Health & Profit Boost Strategy Pack
Download the checklist above, plug in your data, and start turning quality insights into measurable business improvement today.


