Why a Consistent Reporting Format Matters
Project stakeholders need clear, concise, and consistent information to make quick decisions. A well‑defined project management reporting format structure reduces miscommunication, highlights risks early, and keeps the project on schedule and budget.
Core Elements of a Project Management Report
Every report should contain the following sections, regardless of industry or project size:
- Executive Summary – One‑page snapshot of status, key risks, and next steps.
- Schedule Performance – Planned vs. actual dates, % complete, critical path changes.
- Budget Overview – Original budget, incurred costs, variance, forecast to completion.
- Scope & Change Management – New scope items, approved changes, impact on schedule and cost.
- Resource Utilization – Allocation, hours worked, over‑/under‑utilized resources.
- Quality & Deliverables – Acceptance criteria met, defects, re‑work.
- Risk & Issue Log – Top risks, mitigation actions, current issues.
- Key Decisions Required – Items needing sponsor or steering committee sign‑off.
Standard Visuals for Faster Insight
Visual cues help readers grasp the health of the project at a glance.

Use a traffic‑light colour scheme:
- Green – On track.
- Yellow – Warning, needs attention.
- Red – Critical, immediate action required.

Formatting Tips for Different Audiences
Tailor the depth of detail to the reader:
- Executive Sponsors – One‑page dashboard, focus on KPIs, risks, and decisions.
- Project Team – Detailed task‑level updates, daily or weekly.
- Functional Managers – Resource and budget allocation tables.
Consider creating two versions of the same report: a high‑level summary and a detailed appendix.
Industry‑Specific Examples
IT Software Development
Key metrics: sprint velocity, backlog health, defect density, release readiness. Include a burndown chart and a release‑risk matrix.
Construction Projects
Key metrics: Gantt schedule adherence, labor hours, material cost variance, safety incidents. Visualise critical path shifts with a Gantt snapshot.
Marketing Campaigns
Key metrics: lead generation, conversion rate, spend vs. budget, ROI. Dashboards should feature funnel charts and channel‑performance heat maps.
Step‑by‑Step Checklist to Build Your Report
| Step | Action | Output |
|---|---|---|
| 1 | Gather raw data from PM tools (schedule, cost, risks) | Data export files |
| 2 | Validate numbers against baseline | Confirmed variance calculations |
| 3 | Populate the standard sections (see Core Elements) | Draft report document |
| 4 | Create visual dashboards (traffic‑light matrix, Gantt, charts) | Embedded graphics |
| 5 | Tailor language for each audience and add decision log | Finalized report versions |
| 6 | Distribute via email or shared drive and archive the version | Distribution log |
Tools to Speed Up Your Reporting
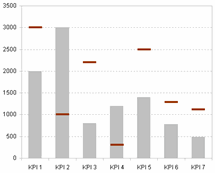
Use ready‑made Excel templates to automate data consolidation and visualization. A one‑page executive Excel report template provides pre‑built charts, colour‑coded KPIs and a printable layout that fits the structure described above.
For deeper financial analysis, the financial dashboard Excel can be linked to your project cost data for real‑time variance tracking.
Putting It All Together
By following the standardized format, you ensure every stakeholder receives the right information at the right time. Consistency builds trust, accelerates decision‑making, and keeps your project moving forward.
Start today by downloading a ready‑made template and customizing it to your project’s unique needs.
Explore the one‑page executive Excel report template to jump‑start your reporting process.


