Why Track Procurement Performance?
Effective procurement is a cost‑saving engine for any organization. By measuring performance you can:
- Identify savings opportunities before they disappear.
- Benchmark suppliers and internal processes against industry standards.
- Prioritize improvement initiatives with data‑driven confidence.
- Show the strategic value of procurement to senior leadership.

Core Procurement Performance Metrics
Below are the eight most commonly‑used metrics. Each includes a brief definition, why it matters, and a simple way to calculate it.
1. Product Price Variance
What it measures: The gap between the contract unit price you pay and an external reference price (e.g., market index).
Why it matters: Highlights over‑paying and helps negotiate better pricing.
Formula: ((Contract Price – Reference Price) ÷ Reference Price) × 100%
2. Effective Contract Utilization
Tracks the percentage of spend that runs under an existing contract versus ad‑hoc purchases.
- Higher utilization = better leverage of negotiated terms.
- Measure for purchase orders, annual contracts, and multi‑year contracts.
3. Expiration Management of Procured Products
Measures the value of goods that expire before use.
- Expressed as
(Expired Spend ÷ Total Spend) × 100%. - Break down by category (e.g., donated items for non‑profits).
4. Supplier Performance
Aggregates delivery quality, timeliness, and compliance.
- Use a scorecard (on‑time % + quality % + compliance %) / 3.
- Identify under‑performing suppliers for corrective action.
5. Procurement Cycle Time
Average number of days from requisition to purchase order issuance.
Formula: Total Days of All Cycles ÷ Number of Cycles
6. Payment Processing Time
Percentage of invoices paid within agreed payment terms.
Formula: (Invoices Paid On‑Time ÷ Total Invoices) × 100%
7. Emergency Procurement Ratio
Share of spend that occurs under emergency conditions.
Formula: (Emergency Spend ÷ Total Spend) × 100%
8. Procurement Cost per Order
Total internal cost (staff, systems, overhead) divided by the number of orders processed.
Formula: Total Procurement Cost ÷ Number of Orders
Industry‑Specific Examples
Manufacturing
- Price variance: Compare steel purchase contracts to the London Metal Exchange price.
- Cycle time: Target ≤ 5 days for critical component orders to keep the production line moving.
Healthcare
- Expiration management: Track expired pharmaceuticals; aim for < 1% expiration rate.
- Supplier performance: Use sterility and on‑time delivery as key criteria.
Non‑Profit / Humanitarian Aid
- Donated product expiry: Measure the % of donated food that expires before distribution.
- Emergency procurement: Proportion of disaster‑relief spend vs. regular spend.
How to Build a Simple Procurement Metrics Dashboard
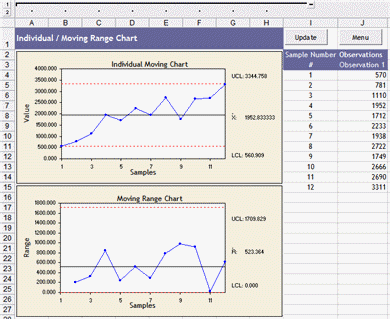
Use an Excel‑based dashboard to visualise the metrics above. The steps are:
- Collect raw data from ERP, spend analysis tools, and supplier scorecards.
- Standardise fields (date, supplier, product, cost, status).
- Create a master table that feeds each metric calculation.
- Use Financial Dashboard Excel templates for charts and traffic‑light indicators.
- Refresh the data monthly and review trends with the procurement team.
Sample Metric Table
| Metric | Formula | Data Source | Target |
|---|---|---|---|
| Product Price Variance | ((Contract – Reference) ÷ Reference) × 100% | Contract database + market index | < 5% |
| Contract Utilization | (Spend Under Contract ÷ Total Spend) × 100% | Spend system | > 80% |
| Expired Spend | (Expired ÷ Total) × 100% | Inventory management | < 1% |
| Supplier On‑Time Delivery | (On‑Time Deliveries ÷ Total Deliveries) × 100% | Logistics system | > 95% |
| Procurement Cycle Time | Total Days ÷ Number of Purchases | ERP requisition module | < 7 days |
| Payment Processing Time | (Invoices Paid On‑Time ÷ Total Invoices) × 100% | Accounts Payable | > 90% |
| Emergency Procurement Ratio | (Emergency Spend ÷ Total Spend) × 100% | Spend system (tagged emergencies) | < 5% |
| Cost per Order | Total Procurement Cost ÷ Number of Orders | Finance + Procurement | Reduce 10% YoY |
Next Steps
Start by picking three metrics that matter most to your organization. Build a simple Excel sheet using the table above, then review the results with your team. As you gain confidence, expand to the full set of eight metrics and integrate them into a strategic scorecard.
Looking for a ready‑made framework? Explore the Balanced Scorecard and Strategy Map Toolkit to turn these metrics into a strategic dashboard that aligns procurement with overall corporate goals.


