Measuring Process Performance: A Comprehensive Guide for Planning and Tracking Process Metrics
Process performance measurement is essential for managers across production, manufacturing, logistics, supply chain, and operations. Each domain focuses on different process factors such as cost, quality, flexibility, and speed. However, some key process performance metrics and measures provide a foundation for tracking and improving operational effectiveness.
Key Categories of Process Performance Metrics
Understanding and measuring process performance requires categorizing metrics to reflect different aspects of operations, including labor, capacity, and efficiency. Below are examples and explanations of critical metrics within these categories.
Labor-Related Process Performance Metrics
- Direct Labor: The amount of labor directly involved in producing a product or delivering a service. This excludes nonproductive time such as maintenance, equipment downtime, or waiting for materials.
- Direct Labor Utilization Percentage: The percentage of available labor capacity actively engaged in direct work. Monitoring this helps optimize workforce productivity and reduce idle time.

Capacity Process Performance Metrics
- Capacity Utilization: The percentage of the process’s maximum capacity that is actually utilized. It reflects how effectively resources are used.
- Process Capacity: The highest achievable output rate, measured in units produced over a time period. The overall capacity depends on the bottleneck or minimum capacity step in the process flow. For parallel process lines, total capacity is usually the sum of individual capacities unless output rates differ significantly.

Efficiency Process Performance Metrics
- Throughput Rate: The average number of units moving through a process segment per unit of time. Ideally, this matches the process capacity.
- Process Flow Time: The total time it takes for a unit to flow from process start to finish, including processing and waiting times.
- Process Cycle Time: The time between completion of consecutive units. It’s the inverse of the throughput rate and reflects how quickly activities are repeated.
- Process Idle Time: Time when no activity occurs, such as waiting for inputs or downtime in equipment or personnel.
- Set-Up Time: The time required to prepare tools or equipment for a task. Set-up time is generally independent of batch size and can be reduced on per-unit basis by increasing batch size.
- Work In Process (WIP): The number of units currently in the process but not yet completed.
- Process Time: The actual time a unit is worked on, calculated as flow time minus idle time.

Industry-Specific Examples of Process Performance Metrics
Manufacturing
- Overall Equipment Effectiveness (OEE): Combines availability, performance efficiency, and quality rate into one comprehensive measure.
- First Pass Yield (FPY): Percentage of products manufactured correctly without rework.
Logistics and Supply Chain
- Order Cycle Time: Time taken from order receipt to delivery.
- Perfect Order Rate: Percentage of orders delivered without issues such as delays or damages.
Service Operations
- Customer Wait Time: Time customers wait to receive service.
- Service Cycle Time: Average time to complete a service transaction.
How to Use Process Performance Metrics Effectively
Tracking metrics alone is not enough. Managers should ensure the following for effective process performance management:
- Define clear objectives aligned with business goals.
- Select relevant metrics that provide actionable insights.
- Regularly collect and analyze data to identify trends and bottlenecks.
- Benchmark performance against industry standards or historical data.
- Continuous improvement based on metric analysis and root cause identification.
Process Performance Metrics Checklist
| Metric | What It Measures | How to Use It |
|---|---|---|
| Direct Labor Utilization | Labor productivity and engagement | Identify underused labor and plan workforce allocation |
| Capacity Utilization | Resource utilization effectiveness | Optimize process layout and reduce idle capacity |
| Throughput Rate | Output velocity | Balance production flow and reduce bottlenecks |
| Process Flow Time | Total time from start to finish | Identify delays and improve cycle times |
| Set-Up Time | Preparation overhead | Reduce changeover times to increase flexibility |
| Work In Process (WIP) | Inventory within the process | Minimize WIP to shorten lead times and reduce costs |
Step-by-Step Guide to Implementing Process Performance Measurement
- Identify Process Goals: Define what you want to improve (e.g., reduce cost, improve speed).
- Select Metrics: Choose appropriate metrics aligned with goals.
- Gather Data: Collect accurate process data regularly using reliable tools.
- Analyze Results: Interpret data to find bottlenecks and inefficiencies.
- Make Improvements: Implement targeted solutions (e.g., staff retraining, equipment upgrade).
- Monitor Continuously: Keep tracking metrics to ensure sustained improvement.
- Report and Communicate: Share insights with stakeholders to support decision-making.

Summary
Process performance metrics provide a clear view of how business activities operate and where improvements are needed. By focusing on labor, capacity, and efficiency metrics, managers can better understand operational strengths and weaknesses. Adopting industry-specific metrics and a structured measurement approach ensures process optimization and competitive advantage.
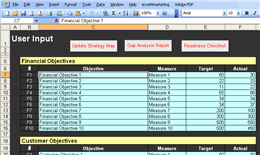
For enhanced reporting and strategic management of your process performance, explore tools designed to streamline performance tracking and decision-making like the Balanced Scorecard and Strategy Map Toolkit. This resource integrates key performance indicators into actionable dashboards, helping managers turn metrics into measurable results.


