What Is a Gap Analysis?
A gap analysis compares your current performance with the desired future state. By quantifying the gap, you can prioritize actions, allocate resources, and track progress objectively.
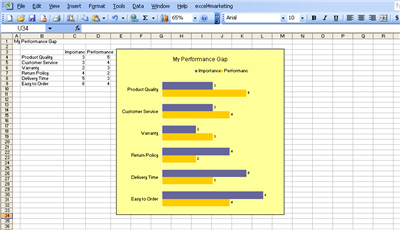
Free Gap Analysis Excel Template
Below is a ready‑to‑use Excel workbook that lets you capture the current state, set target metrics, and monitor execution month after month.
🚀 Turn KPIs into action in 10 minutes/week. Stop tracking, start executing with 3Moves. Get your first 3 moves free. Start 7-Day Trial →
Why Execution Matters
- Most managers can define strategy but struggle to turn it into results.
- The template forces you to bind strategy to measurable KPIs.
- Continuous tracking reveals early signs of drift and lets you course‑correct quickly.
Key Components of the Template
- Current State – Actual performance data pulled from your systems.
- Target State – Desired values for the next quarter, year, or strategic horizon.
- Gap Calculation – Automatic difference (Target – Current) for each metric.
- Action Owner – Person responsible for closing each gap.
- Timeline & Milestones – When you expect progress and how you will measure it.
How to Use the Template – Step‑by‑Step Recipe
- Collect Baseline Data: Export the latest numbers for sales, cost, churn, production volume, etc.
- Define Targets: Align each metric with the strategic goals in your Business Plan Template.
- Enter Data: Paste the baseline into the “Current” column and targets into the “Target” column.
- Review Gaps: The sheet automatically calculates the variance and highlights large gaps.
- Assign Owners & Deadlines: Fill in the responsible stakeholder and the expected completion date.
- Monitor Monthly: Update the “Current” column each month. The chart below updates in real time.

Industry‑Specific Examples
- Retail – Sales Growth: Current $12M, Target $15M → $3M gap. Track weekly foot‑traffic and conversion rate.
- SaaS – Customer Churn: Current 8%, Target 5% → 3% gap. Monitor monthly renewal rates and support tickets.
- Manufacturing – Production Efficiency: Current 78%, Target 90% → 12% gap. Use the Activity‑Based Costing Excel sheet to allocate overhead and pinpoint bottlenecks.
Tracking Progress with KPIs
Pair the gap analysis with a robust KPI dashboard. The Financial Dashboard Excel lets you visualize:
- Revenue vs. Target
- Cost‑of‑Goods‑Sold variance
- Operating margin trends
- Customer acquisition cost (CAC) and Lifetime Value (LTV)
Quick‑Start Checklist
| Task | Completed? |
|---|---|
| Export current performance data | |
| Set strategic targets (aligned with business plan) | |
| Enter data into Gap Analysis template | |
| Calculate gaps and prioritize | |
| Assign owners and deadlines | |
| Update monthly and review chart |
Download the Free Gap Analysis Template
Click below to get the Excel file instantly. Use it with the Balanced Scorecard and Strategy Map Toolkit for a complete performance‑management system.
Download Your Free Gap Analysis Template
Start closing the gaps today and turn strategic intent into measurable results.


