Why a Strong Marketing Report Matters
A well‑structured marketing report turns raw data into actionable insight. It helps stakeholders understand performance, justify spend, and guide future strategy. Below is a step‑by‑step workbook you can follow to create a professional report that drives decisions.
Core Sections of Every Marketing Report
All effective reports share the same backbone. Use the checklist at the end of this post to ensure every piece is in place.
1. Title Page
- Report title (e.g., “Q2 2024 Digital Campaign Review”).
- Prepared by – name, title, and contact.
- Client or business name.
- Report date.
2. Table of Contents
Give readers a quick map. Use a clear hierarchy and page numbers (or anchor links for a PDF).
3. Executive Summary
Summarize key findings in 1‑2 pages. Include:
- Top‑line performance metrics.
- Major successes and challenges.
- Primary recommendations.
4. Introduction & Objectives
Set context:
- Background of the campaign or initiative.
- Business goals the marketing effort supports.
- Specific questions the report will answer.
5. Research Methodology & Data Sources
Explain how you gathered data so readers trust the analysis.
- Surveys – sample size, question list, and timing.
- Analytics tools – Google Analytics, social listening platforms, CRM.
- Third‑party data – market research firms, industry benchmarks.
6. Detailed Findings (Researched Data)
Present raw data and observations. Use tables, charts, and screenshots to make numbers visual.
- Channel‑by‑channel performance (e.g., paid search, email, social).
- Audience segmentation results.
- Conversion funnel analysis.
7. Analysis & Summarized Data
Turn data into insight. Answer the questions posed in the introduction.
- What worked well? (e.g., “Facebook carousel ads drove 35% higher CTR”).
- What underperformed? (e.g., “Organic LinkedIn posts saw <5% engagement”).
- Root‑cause analysis – link performance to audience behavior, timing, creative.
8. Recommendations & Next Steps
Provide clear, prioritized actions.
- Short‑term tactics (next 30 days).
- Medium‑term strategy (next quarter).
- Long‑term measurement plan.
9. Conclusions
Wrap up with a concise recap of key takeaways and the impact on business goals.
Tips for Making Your Report Stand Out
- Use visual storytelling: charts, heat maps, and infographics help readers grasp trends quickly.
- Keep language simple: avoid jargon unless your audience is highly technical.
- Include a glossary: define metrics like CAC, ROAS, and LTV for non‑marketing stakeholders.
- Proofread for consistency: ensure formatting, fonts, and colors match your brand style guide.
Industry‑Specific Example: SaaS Product Launch
When reporting on a SaaS launch, focus on metrics that matter to subscription businesses:
- Free‑trial conversion rate.
- Monthly recurring revenue (MRR) growth.
- Churn and net‑revenue retention.
Structure the report exactly as above, but replace the “Channel‑by‑channel” section with a “Product‑usage” section that highlights feature adoption.
Resources to Accelerate Your Reporting Process
Boost efficiency with ready‑made templates and automation tools:
- Marketing Plan Template – align your report with broader strategy.
- Marketing Promotion Strategy Pack – get pre‑built promotion frameworks.
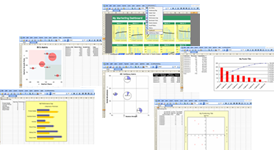
- Automated Excel Reporting – turn raw data into charts with a click.
- One‑Page Executive Report Template – perfect for senior leadership.
Checklist: Build Your Marketing Report in One Sitting
| Section | Completed? | Notes |
|---|---|---|
| Title Page | ☐ | Include report date and author. |
| Table of Contents | ☐ | Hyperlink sections if PDF. |
| Executive Summary | ☐ | Limit to 1‑2 pages. |
| Introduction & Objectives | ☐ | State business goals. |
| Methodology | ☐ | List tools and sample sizes. |
| Findings | ☐ | Use charts & tables. |
| Analysis | ☐ | Answer key questions. |
| Recommendations | ☐ | Prioritize actions. |
| Conclusions | ☐ | Summarize impact. |
Next Steps
Download our free Marketing Plan Template to align the report with your overall strategy and start building insight‑driven campaigns today.

Free Marketing Report Templates


