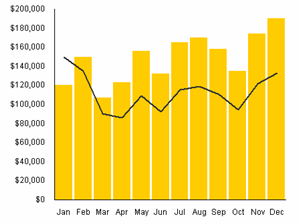
How To Make A Budget Chart to Track Budget Costs with Excel
Creating a budget chart is essential when you want to clearly communicate your budget information across teams and managers within your organization. Simply inserting your budget data into a spreadsheet and sharing it is often not enough. Visualizing the data helps to improve understanding, save time, and make key insights easier to grasp.
Many stakeholders, especially executives, may not have the time to analyze rows of numbers. A budget chart gives them a quick overview of financials and budget performance.

Using a pie chart, bar chart, or combination chart to visualize your data in Excel can make your reporting much more effective without incurring extra cost on advanced tools. Excel provides a low-cost, easy-to-use platform for creating compelling budget charts.
Step-by-Step Guide: How To Make A Budget Chart in Excel
Step 1: Prepare Your Budget Data
- Create four main columns: Items, Budget Amount, Actual Amount, and Difference.
- Under the Items column, add two main categories: Income and Expenses, followed by a Total row.
Step 2: Fill Income and Expense Details
- Under Income, list sub-items like Royalties, Dividends, and Interest.
- Under Expenses, list sub-items such as Advertising Cost, Sales Material Costs, Rent for Production Equipment, Direct Labor, and Property Taxes.
Step 3: Calculate the Difference
- In the Difference column, calculate the variance by subtracting the Actual Amount from the Budget Amount for each item (
=Budget Amount - Actual Amount). - This will help you quickly identify which expenses or income streams deviated from the plan.
Step 4: Create the Budget Chart
- Select the data range you want to visualize.
- Go to the Insert tab in Excel and click on Recommended Charts.
- Choose a chart type (Column, Pie, or Combination Chart) that best represents your budget data.
- Customize your chart by clicking on the chart’s upper right corner to edit titles, axis labels, and displayed data.
- If you don’t see the chart tools, click anywhere on the chart to make them appear on the Excel ribbon.
Tips For Making Your Budget Chart More Effective
- Use Color Wisely: Differentiate income and expenses with distinct colors.
- Add Data Labels: Show exact numbers on your chart for clarity.
- Include a Title: Make sure your chart has a descriptive title.
- Keep It Simple: Avoid clutter by focusing only on key budget components and trends.
Examples of Budget Charts for Different Industries
Small Business Monthly Budget
- Track your income streams and operational expenses.
- Use bar charts to compare planned versus actual costs monthly.
Nonprofit Organization Budget
- Track donations (income) versus program costs (expenses).
- Use pie charts to show expense distribution across programs.
Marketing Budget
- Compare advertising spend across various channels like digital, print, and events.
- Use combination charts to correlate budgeted amounts, actual spend, and ROI.
Budget Chart Workbook: Your Step-by-Step Checklist
| Step | Action | Details / Tips |
|---|---|---|
| 1 | Set Up Columns | Define Items, Budget Amount, Actual Amount, Difference columns. |
| 2 | List Income and Expenses | Include relevant subcategories for your organization. |
| 3 | Calculate Difference | Use formula: Budget – Actual for easy tracking. |
| 4 | Create Chart | Insert recommended chart and customize it. |
| 5 | Review & Refine | Adjust colors, labels, and layout for clarity. |
Final Thoughts
Creating a budget chart in Excel is a straightforward way to enhance how you track and present budget costs. With a well-structured sheet and a clear chart, stakeholders can quickly grasp financial performance and make informed decisions.
For enhanced financial management and ready-to-use templates, explore our Financial Statements Templates to help scale your budgeting process efficiently and professionally.


