Understanding Break Even Analysis
Many entrepreneurs launch products or services without fully understanding the complete costs involved or the right price points to charge. As a result, they often find they cannot sell enough volume to generate a profit.
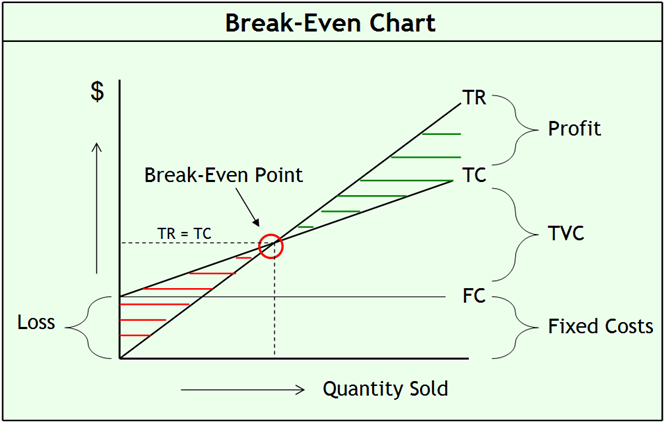
Break even analysis is a powerful financial tool that helps you determine the exact sales volume needed to cover all your costs, ensuring you avoid losses and build a profitable business model.
This analysis is valuable for every product or service you offer. It calculates the number of units that must be sold to reach a profit threshold, enabling more informed business decisions.
Basic Break Even Example
Imagine your monthly fixed costs to operate your business are $5,000. Your product sells for $500 per unit, and each unit costs approximately $400 to produce, sell, and ship.
- The profit margin per unit is $100 ($500 – $400).
- Dividing fixed costs ($5,000) by profit per unit ($100) gives 50 units.
- You must therefore sell 50 units monthly to break even.
- Only after selling over 50 units do you start generating profit of $100 per unit sold.
Step-by-Step Guide to Conduct a Break Even Analysis
Conducting an accurate break even analysis requires thorough cost evaluation and price assessment. Follow these steps to analyze any product or service effectively:
Step 1: List Your Fixed Costs
- Rent, utilities, salaries, insurance
- Any costs that stay constant regardless of sales volume
Step 2: Calculate Variable Costs Per Unit
- Production, packaging, shipping, commissions
- Costs that vary directly with each unit produced or sold
Step 3: Determine Sales Price Per Unit
- Market rate you can reasonably charge
- Competitive pricing analysis
Step 4: Compute Contribution Margin
- Sales price per unit minus variable cost per unit
- Represents profit gained from each unit after variable costs are covered
Step 5: Calculate Break Even Sales Volume
- Fixed costs divided by contribution margin
- Number of units to sell to cover all fixed and variable costs
Step 6: Review and Adjust
- Analyze profitability of products/services by priority
- Consider discontinuing low-margin offerings
- Plan based on market changes and evolving customer needs
Industry-Specific Examples of Break Even Analysis
Retail Business
- Fixed costs: rent, staff wages, utilities
- Variable costs: wholesale price, packaging, shipping
- Use analysis to decide which products to stock or promotions to run
Service-Based Business
- Fixed costs: office rent, software subscriptions, salaried employees
- Variable costs: contractor fees, materials, travel expenses
- Calculate minimum billable hours or projects for profitability
Manufacturing
- Fixed costs: machinery, facility, administrative staff
- Variable costs: raw materials, direct labor per unit, packaging
- Identify production volume needed to avoid losses
Tips for Maximizing Break Even Analysis Impact
- Update costs regularly to reflect market changes
- Use break even analysis alongside pricing and profit optimization strategies
- Perform break even calculations for each product or service separately
- Leverage Excel templates or financial dashboards to automate calculations and visualize data
Simple Break Even Analysis Template (Example)
| Item | Value | Description |
|---|---|---|
| Fixed Costs | $5,000 | Monthly overhead (rent, salaries, etc.) |
| Sales Price Per Unit | $500 | Price charged to customers |
| Variable Cost Per Unit | $400 | Production and delivery cost per unit |
| Contribution Margin | $100 | Sales Price – Variable Cost |
| Break Even Volume | 50 Units | Fixed Costs ÷ Contribution Margin |
Use this simple structure in Excel to track and update your own business figures. This will help you monitor profitability in real-time and make better-informed decisions.
Key Takeaways
- Break even analysis reveals how many units you need to sell to cover costs.
- Understanding fixed and variable costs is essential.
- Use contribution margin to measure profitability per unit.
- Regularly review product and service performance to optimize offerings.
- Leverage Excel templates to simplify and visualize your analysis.
For a comprehensive financial management approach, explore advanced tools that integrate break even analysis with other business planning needs. This will help you automate your forecasts, track profitability, and optimize pricing strategies effectively.
Consider this finance and profit growth toolkit to deepen your financial insights and accelerate business growth.


