Why Sales Goals Matter in a Funnel
Setting clear, measurable sales goals is the backbone of a predictable revenue engine. When each stage of your sales funnel has a defined target, you can:
- Spot bottlenecks before they cost you deals.
- Keep the sales team focused on the right activities.
- Forecast revenue with confidence.
Step‑by‑Step Blueprint for Defining Funnel Goals
1️⃣ Map Your Funnel Stages
Identify the exact steps a prospect travels from first contact to closed‑won. Typical B2B stages include:
- Awareness (website visitors, ad clicks)
- Interest (lead magnet downloads, webinar sign‑ups)
- Consideration (qualified leads, discovery calls)
- Decision (proposals, demos)
- Purchase (closed‑won)
For e‑commerce you might use: Visitors → Product Views → Add‑to‑Cart → Checkout → Purchase.
2️⃣ Set a Revenue Target
Start with the amount of money you need to generate in a given period (monthly, quarterly, yearly). Example: $120,000 per quarter.
3️⃣ Work Backwards Using Conversion Ratios
Apply realistic conversion percentages to each stage. If you know that 5% of qualified leads become customers, you can calculate the required upstream numbers.
| Stage | Desired Output | Conversion Rate | Required Input |
|---|---|---|---|
| Closed‑Won | $120,000 | 100% | $120,000 |
| Proposals | 10 deals @ $12,000 each | 20% | 50 proposals |
| Qualified Leads | 50 proposals | 30% | 167 qualified leads |
| Marketing Leads | 167 qualified leads | 25% | 668 marketing leads |
| Website Visitors | 668 leads | 5% | 13,360 visitors |
Adjust the conversion rates to match your historic data, then recalculate the targets.
4️⃣ Translate Numbers into Daily Actions
Break the upstream goals into activity metrics your reps can control.
- Calls per day → 30 calls = 9 qualified leads per week
- Emails per day → 50 outreach emails = 15 marketing leads per week
- Content pieces per month → 4 blog posts = 200 new visitors each
5️⃣ Track, Review, & Iterate
Use a live dashboard (e.g., Financial Dashboard Excel) to compare actuals vs. targets. Identify which stage is under‑performing and coach the team accordingly.
Industry‑Specific Quick Wins
🔧 B2B SaaS
- Goal: 25 new trial sign‑ups per month → 100% trial‑to‑paid conversion needed for $120k ARR.
- Action: Run weekly webinars and allocate 15 outbound calls per rep.
🛒 E‑Commerce
- Goal: 500 purchases per month at $250 avg order value.
- Action: Increase cart‑abandonment recovery emails to 30% conversion.
Ready‑to‑Use Funnel Goal Checklist
| Task | Completed? |
|---|---|
| Identify all funnel stages and name them clearly. | ☐ |
| Set a period‑specific revenue target. | ☐ |
| Gather historic conversion rates for each stage. | ☐ |
| Calculate required inputs for each stage (calls, leads, visits). | ☐ |
| Assign daily/weekly activity metrics to each rep. | ☐ |
| Build a live dashboard to monitor actual vs. goal. | ☐ |
| Schedule weekly review meetings to adjust tactics. | ☐ |
Print this checklist and keep it on your sales wall. Checking the boxes each week will keep the funnel healthy.
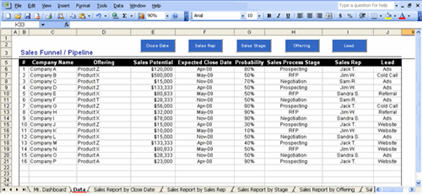
Visual Reference
Next Steps
Implement the checklist, plug your numbers into a dashboard, and start measuring daily activities. When you need a ready‑made framework to accelerate conversion, explore the Sales Conversion Strategy Pack – it includes templates, KPI trackers, and coaching scripts designed for every funnel stage.
Boost your planning with a Marketing Plan Template or visualize your finances using the Financial Dashboard Excel tool.


