Key Takeaway: Unlocking Real-Time Insights for Smarter Workforce Management
Real-time workforce dashboards transform how organizations track and optimize human resources. By visualizing staff availability, workload distribution, and skill utilization, these tools help leaders make faster decisions, reduce burnout, and improve service delivery. This article explains how to implement similar systems in any industry.
Why Real-Time Data Matters for Workforce Management
Traditional workforce reports often rely on outdated data, creating blind spots in resource allocation. A real-time dashboard updates metrics instantly, showing:
- Current staff locations and assignments
- Leave balances and overtime hours
- Training certifications and skill gaps
- Open positions vs. qualified candidates
For healthcare, this means faster redeployment during emergencies. For retail, it ensures optimal staffing during peak hours. The key metric here is staff utilization rate: (Billable hours / Total available hours) x 100.
Building Your Dashboard: 4 Essential Components
Start with these core elements to create actionable insights:
- Dynamic Headcount Tracker – Visualize total workforce size, departmental distribution, and attrition trends using color-coded heat maps.
- Skills Matrix – Tag employees with certifications, language abilities, and technical proficiencies. Update quarterly to identify training needs.
- Workload Balancer – Overlay project timelines with individual capacity metrics to prevent overstaffing or understaffing.
- Compliance Monitor – Track mandatory training completions, licensing renewals, and labor law adherence to reduce legal risks.
Implementation Steps: From Data Chaos to Clarity
Follow this timeline to deploy your system:
- Week 1-2: Audit existing HR systems and identify 8-10 critical metrics (e.g., staff turnover rate, cost per hire).
- Week 3-4: Integrate time-tracking software with HR databases using automation tools like Zapier or Microsoft Power Automate.
- Week 5-6: Build dashboard prototypes in Power BI or Tableau, testing with department managers for usability.
- Week 7: Launch pilot program in one department, measuring adoption rates and decision-making speed improvements.
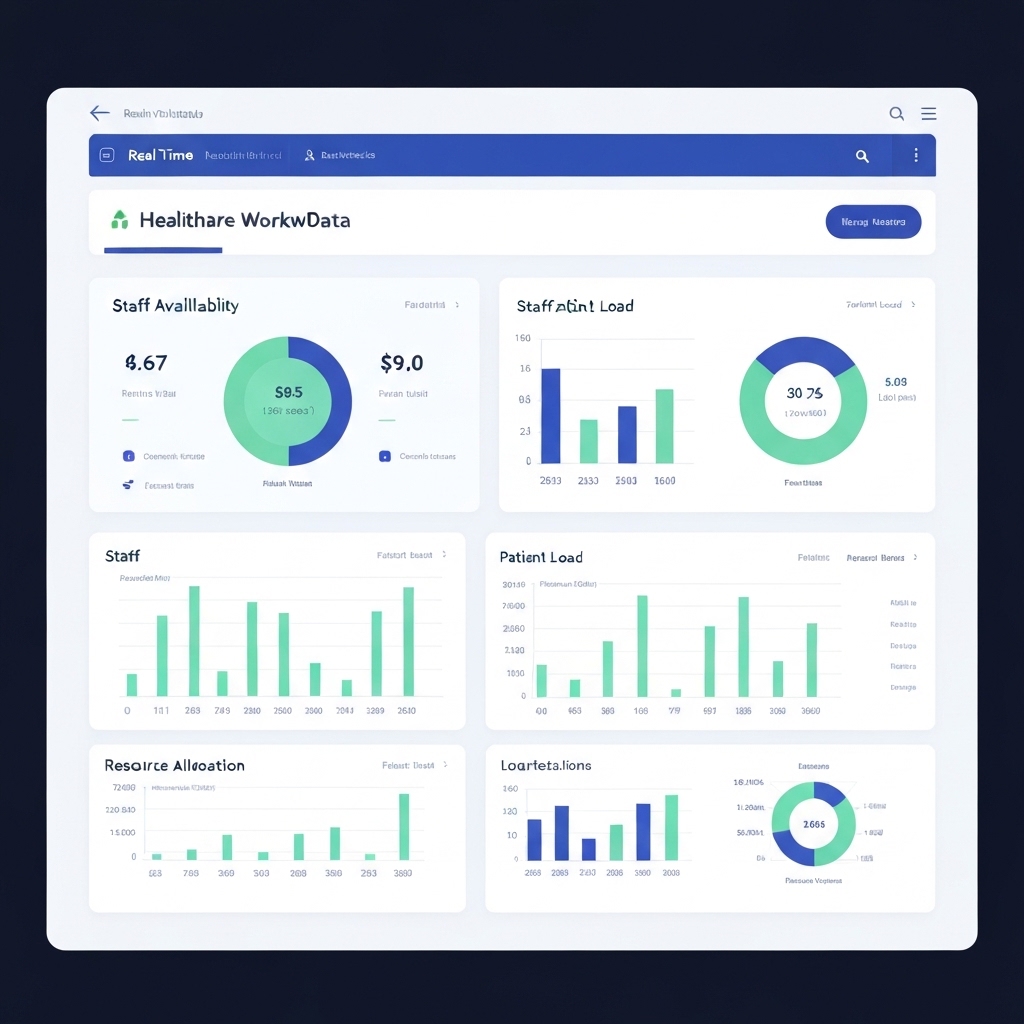
Healthcare Case Study: Emergency Staffing Optimization
A hospital chain reduced ER wait times by 22% using real-time dashboards that showed:
- Current nurse-to-patient ratios
- Available specialists by location
- Equipment maintenance schedules
- Surge capacity planning
When patient volume spiked, managers redeployed staff from less busy departments using the dynamic shift-swapping module, maintaining compliance with labor laws.
Common Pitfalls and How to Avoid Them
Watch out for these implementation challenges:
- Data Silos: Use APIs to connect payroll, scheduling, and performance review systems.
- Over-Complexity: Limit dashboard views to 5-7 KPIs per role to prevent analysis paralysis.
- Privacy Risks: Restrict access to sensitive data like salary information using role-based permissions.
- Low Adoption: Train managers to ask specific questions like, “Who has available capacity to handle urgent projects?”
Action Plan: Start Small, Think Big
Here’s how to begin your dashboard implementation:
- Identify one department with high staff turnover
- Map their current scheduling and reporting workflows
- Select a dashboard tool compatible with existing HR systems
- Build a prototype tracking 3-4 critical metrics
- Measure impact on decision-making speed after 30 days
Remember: The goal isn’t perfect data but faster, evidence-based decisions. Start with what you have, not what you wish you had.
What’s Next: Expanding Dashboard Capabilities
Once the basic system works, add these advanced features:
- AI-driven attrition predictions using historical data
- Cost modeling for workforce restructuring
- Employee sentiment analysis from engagement surveys
- Scenario planning for mergers or market disruptions
Real-time dashboards aren’t just monitoring tools—they’re strategic assets that help organizations adapt faster to changing demands.


