Executive Summary
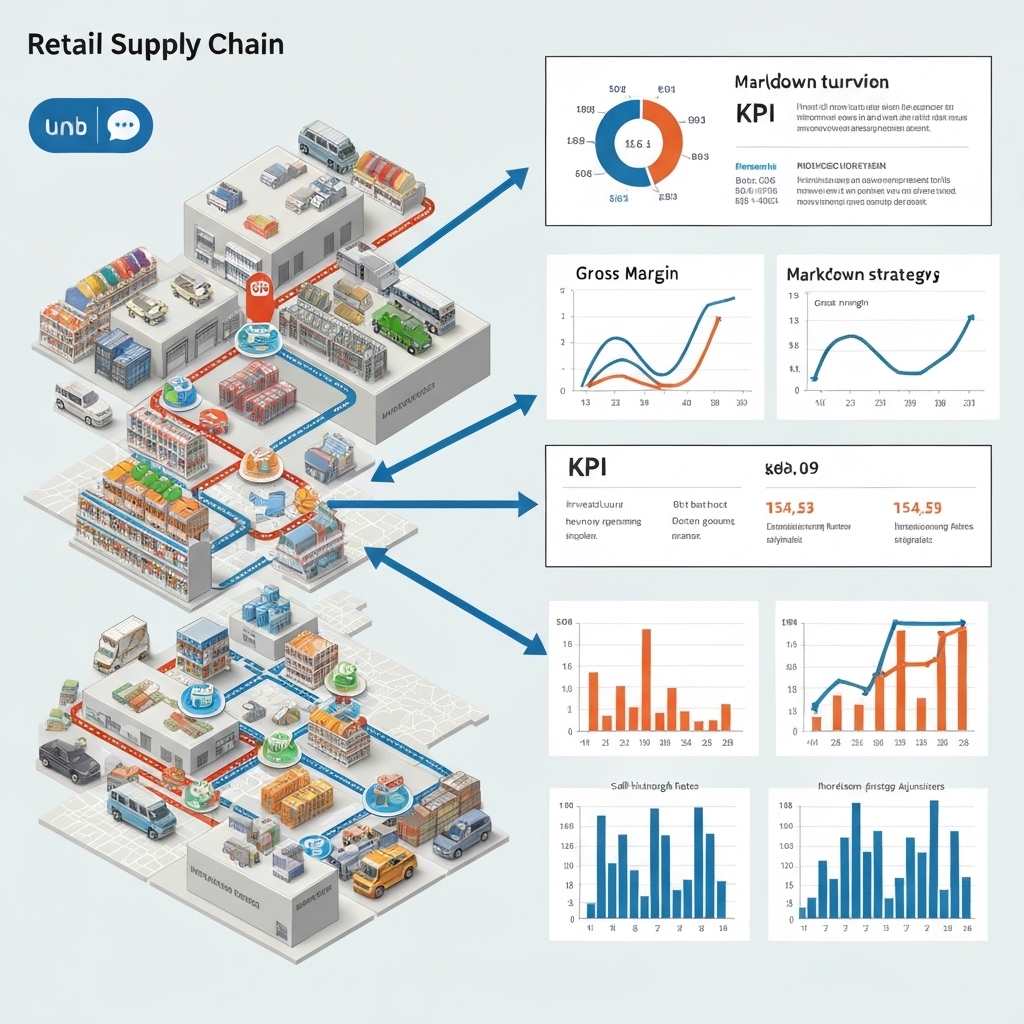
Effective markdown optimization directly impacts critical supply chain KPIs including inventory turnover, gross margin return on investment (GMROI), and stockout rates. Retailers who refine their markdown strategies reduce excess inventory by 20-30% while improving profit margins. This article explains which metrics matter most and how to align pricing decisions with supply chain goals.
What Is Markdown Optimization?
Markdown optimization uses data-driven pricing adjustments to balance inventory levels with profit objectives. Unlike random discounts, this strategy considers:
- Historical sales patterns
- Current inventory age
- Competitor pricing
- Seasonal demand shifts
For example, a retailer might reduce prices on slow-moving winter apparel by 15% in January rather than waiting for end-of-season clearance, capturing higher revenue while freeing warehouse space for new spring stock.
Key Supply Chain KPIs Affected by Markdowns
Inventory Turnover Ratio
Formula: Sales / Average Inventory
Slow-moving stock lowers turnover. Strategic markdowns accelerate sell-through. A 2022 Retail Systems study found optimized markdowns improve turnover ratios by 18% on average through better inventory flow management.
Gross Margin Return on Investment (GMROI)
Formula: Gross Profit / Average Inventory Cost
Excessive markdowns erode margins, but stale inventory costs money too. The goal: find the “markdown sweet spot” where total profit is maximized. Retailers using dynamic pricing tools achieve 12-15% higher GMROI than industry averages.
Stockout Rates
Over-discounting creates artificial demand spikes. Unplanned stockouts damage customer loyalty and create supply chain chaos. Top performers maintain 2-3% stockout rates through markdowns that balance demand with available inventory.
Days Sales of Inventory (DSI)
Formula: Average Inventory / (COGS / 365)
Reducing DSI from 45 to 35 days through targeted markdowns frees up 22% of working capital. This creates cash flow flexibility for restocking high-demand items or investing in marketing campaigns.
Three-Step Markdown Optimization Process
1. Audit Markdown History
Use your POS system to analyze past markdown performance:
- Which products sold fastest after price reductions?
- What discount levels triggered bulk purchases?
- When did clearance items finally sell?
Create a markdown effectiveness scorecard tracking metrics like “time-to-sell” and “profit retention percentage.”
2. Build Dynamic Pricing Rules
Automate adjustments using these triggers:
- Inventory age thresholds (e.g., 60+ days in stock = 10% discount)
- Competitor price changes
- Weather-driven demand shifts (e.g., air conditioner markdowns during heatwaves)
Example: A home goods retailer reduced markdown waste by 27% after implementing rules that automatically adjust prices when inventory exceeds 150% of forecasted demand.
3. Integrate with Supply Chain Planning
Align markdown strategies with procurement cycles. Share real-time inventory data with suppliers to:
- Accelerate replenishment of fast-selling items
- Cancel POs for items with active markdowns but low demand
- Coordinate delivery schedules with clearance events
This reduces supply chain friction and prevents markdown stacking (multiple discounts on the same product).
Things to Remember
Fact: Retailers lose 5-7% of annual profits to poorly timed markdowns (National Retail Federation 2023).
Rule of Thumb: Never discount below 70% of cost without executive approval.
Warning: Over-reliance on markdowns trains customers to wait for sales, eroding brand value.
Action Plan for Immediate Results
- Review current inventory with aging reports – identify items over 45 days old
- Calculate break-even points for each product category
- Test 10% markdowns on top 5 slow-moving SKUs
- Monitor sell-through velocity and adjust pricing weekly
- Update supply chain KPI dashboards with markdown impact metrics
What’s Next?
Implement A/B testing for markdown strategies. Compare results from automated pricing tools vs manual adjustments. Use these insights to refine your markdown calendar for upcoming seasons. Remember: the goal isn’t just to sell inventory faster – it’s to maximize profitability while maintaining supply chain agility.


