Why Financial Ratios and Statements Matter
Financial ratios turn raw numbers into actionable insights. They help you:
- Identify profitability trends.
- Monitor cash‑flow health.
- Compare performance against industry benchmarks.
- Make data‑driven strategic decisions.
Pairing ratios with robust statements (P&L, balance sheet, cash flow) gives a 360° view of business health.
Core Financial Ratios Every Manager Should Track
Profitability Ratios
- Gross Margin = (Revenue – COGS) ÷ Revenue
- Operating Margin = Operating Income ÷ Revenue
- Net Profit Margin = Net Income ÷ Revenue
Liquidity Ratios
- Current Ratio = Current Assets ÷ Current Liabilities
- Quick Ratio = (Cash + Receivables + Marketable Securities) ÷ Current Liabilities
Leverage Ratios
- Debt‑to‑Equity = Total Debt ÷ Total Equity
- Interest Coverage = EBIT ÷ Interest Expense
Efficiency Ratios
- Inventory Turnover = COGS ÷ Average Inventory
- Accounts Receivable Days = (Accounts Receivable ÷ Revenue) × 365
Building a Financial Dashboard in Excel
Turn these ratios into a live dashboard with our ready‑to‑use Excel template. Follow these steps:
- Gather data – Pull the latest numbers from your accounting system into a clean data sheet.
- Calculate ratios – Use simple formulas (see the list above) to produce KPI values.
- Design visuals – Insert line charts for trends, pie charts for expense breakdowns, and gauge charts for profit margins.
- Add slicers – Let users filter by period, product line, or region.
- Automate refresh – Connect the workbook to Power Query for daily updates.
For a step‑by‑step guide, download the Automated Excel Reporting Toolkit.
Traditional Costing vs. Activity‑Based Costing (ABC)
Traditional costing spreads overhead based on a single driver (e.g., labor hours). ABC allocates costs to the actual activities that consume resources, giving a more precise picture of true product cost.
Use our Activity‑Based Costing Excel model to map activities, assign drivers, and calculate per‑product costs.
Accounts Receivable Management Best Practices
Effective AR management speeds cash inflows and reduces bad‑debt risk.
- Monitor aging reports weekly.
- Set automatic reminders for overdue invoices.
- Offer early‑payment discounts where appropriate.
- Use the Accounts Receivable Excel Template to track invoices, payments, and days sales outstanding.
Purchasing KPI Dashboard
Purchasing is no longer just about price; it’s about value, risk, and supplier performance.
Key purchasing metrics include:
- Purchase Price Variance (PPV)
- Supplier Lead‑Time Compliance
- Cost of Quality (CoQ)
- Total Cost of Ownership (TCO)
Combine these metrics in a single sheet using the Financial Dashboard Excel to monitor supplier health and strategic spend.
Volume‑Cost‑Profit (VCP) & Break‑Even Analysis
VCP models reveal how changes in volume, cost structure, or price affect profit.
- Identify fixed and variable costs.
- Calculate contribution margin = Price – Variable Cost per unit.
- Break‑Even Units = Fixed Costs ÷ Contribution Margin.
- Run “What‑If” scenarios with the Break‑Even Excel template.
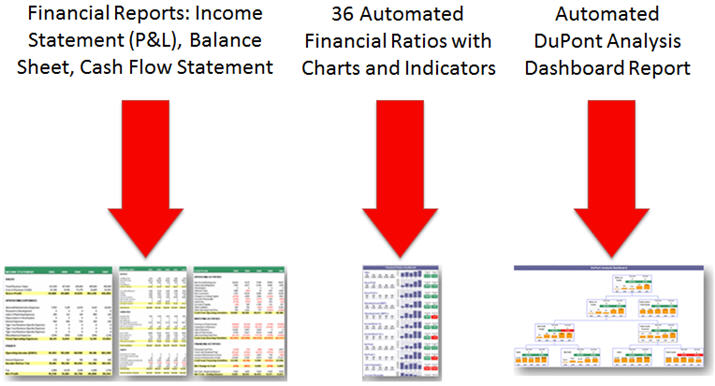
Analyzing Financial Statements
Understanding the three core statements is essential:
- Income Statement (P&L) – Shows profitability over a period.
- Balance Sheet – Snapshots assets, liabilities, equity.
- Cash Flow Statement – Tracks cash generation and usage.
Download the complete Financial Statements Templates Pack to standardize reporting across your organization.
Financial Projections & Planning
Turn a business plan into a financial roadmap with templates that cover:
- Revenue forecasts by product line.
- Expense budgeting (fixed vs. variable).
- Cash‑flow runway analysis.
Our Financial Business Plan Excel Templates include pre‑built sheets for 3‑, 5‑, and 10‑year projections.
Cost‑Benefit Analysis (CBA) Essentials
Use CBA to weigh the monetary value of a project against its costs.
- Identify all relevant costs (direct, indirect, opportunity).
- Quantify benefits (revenue lift, cost savings, risk reduction).
- Calculate Net Present Value (NPV) to assess profitability.
The Finance Profit Growth Toolkit includes a CBA worksheet ready for immediate use.
Top 3 Profit Ratios to Track
- Gross Profit Ratio – Indicates core production efficiency.
- Operating Profit Ratio – Shows how well operating costs are managed.
- Net Profit Ratio – Measures overall profitability after all expenses.
Visualize these ratios on a quarterly dashboard using the Financial Dashboard Excel template.
DuPont Analysis for Return on Equity (ROE)
DuPont breaks ROE into three drivers:
- Profit Margin = Net Income ÷ Revenue
- Asset Turnover = Revenue ÷ Total Assets
- Equity Multiplier = Total Assets ÷ Equity
Multiply the three to get ROE. Use the DuPont Analysis Excel sheet to isolate which driver needs improvement.
Working Capital Management
Effective working capital keeps your business agile.
- Keep the cash conversion cycle below 60 days.
- Optimize inventory levels with ABC analysis.
- Negotiate better payment terms with suppliers.
Track all components in a single worksheet linked to the master dashboard.
Inventory Management & ABC Classification
Classify inventory into:
- A‑items – High‑value, low‑quantity.
- B‑items – Moderate value and turnover.
- C‑items – Low‑value, high‑quantity.
Apply the ABC Costing Excel model to allocate storage and handling costs accurately.
Balanced Scorecard – Financial Perspective
The financial perspective links traditional KPIs to strategic goals.
- Revenue Growth Rate
- Operating Cost Ratio
- Return on Investment (ROI)
- Economic Value Added (EVA)
Integrate these metrics into your dashboard with the Balanced Scorecard and Strategy Map Toolkit.
Quick Reference Checklist
| Area | Key Action | Template / Tool |
|---|---|---|
| Profitability | Calculate Gross, Operating, Net Margins monthly. | Profitability Dashboard |
| Liquidity | Monitor Current & Quick Ratios each quarter. | Liquidity Tracker |
| Leverage | Update Debt‑to‑Equity and Interest Coverage. | Leverage Dashboard |
| AR Management | Run aging report weekly; follow up on >30‑day items. | AR Excel Template |
| Costing | Implement ABC costing for all major activities. | ABC Costing Model |
| Forecasting | Prepare 12‑month revenue & expense forecasts. | Projection Templates |
Next Steps
Start building your own financial intelligence system today. Grab the Financial Dashboard Excel template and begin tracking the KPIs that matter most to your business.


