KPI Dashboard Excel Templates for Effective Sales Metrics Tracking
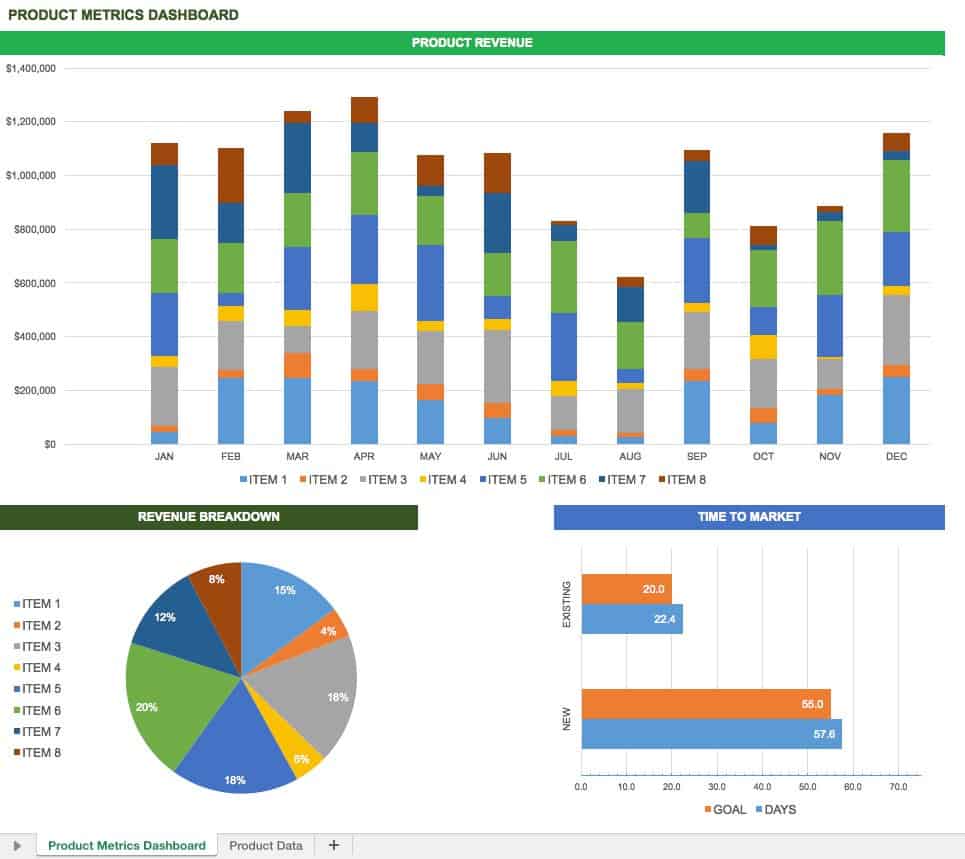
Sales departments thrive on clear, actionable data. An Excel Sales KPI Dashboard template is designed to provide essential performance metrics in an easy-to-understand, visual format. These dashboards include trend charts, target attainment, sales forecasts, and comparisons with previous years, offering a holistic view of sales performance.
Using a Sales KPI Dashboard, sales teams and managers can track key performance indicators (KPIs) aligned with business objectives and growth targets. It answers critical questions such as: What sales numbers matter most? Which KPIs best reflect success? How do current figures compare to past performance and targets?
Why Use Excel Sales KPI Dashboard Templates?
- Standardized Metrics: Focus on the most relevant sales indicators without confusion.
- Time Savings: Skip building dashboards from scratch—use ready-made templates customizable to your needs.
- Visual Insights: Easily interpret monthly and cumulative results through clean graphs and summary tables.
- Comparison Friendly: Analyze performance against previous years and set targets effortlessly.
- Flexibility: Add or modify KPIs to suit your specific sales strategy or department focus.
Key Sales KPIs to Track with Excel Dashboards
- Sales Growth: Measures revenue increase over time.
- Sales Targets Attainment: Percentage of sales goals met during a period.
- Average Deal Size: The average value of closed sales.
- Sales Conversion Rate: Ratio of leads converted to customers.
- Sales Funnel Metrics: Number of contacts, prospects, and closed deals.
- Customer Acquisition Cost: Expense involved in gaining a new customer.
- Sales Forecast Accuracy: How closely sales forecasts match actual results.
Planning and Designing Your Sales KPI Dashboard
The success of a Sales KPI Dashboard lies in focusing on the right metrics for your department’s goals. Avoid mixing irrelevant data—such as HR metrics—with sales performance indicators, which can dilute clarity.
Steps to plan an effective dashboard include:
- Identifying key sales goals and related performance indicators.
- Setting realistic targets and review intervals (weekly, monthly, quarterly).
- Choosing simple, visually appealing charts and tables to present data.
- Incorporating comparisons over time for trend identification and forecasting.
Sales Manager Dashboard Template and Sales Tracking Dashboard Template Overview
These templates are designed to track business, department, and individual sales performance systematically. They feature clear tables highlighting vendor and salesperson effectiveness supported by relevant KPIs.
The dashboards are intentionally designed with minimal colors and straightforward graphs to ensure easy reading and quick comparison without overwhelming the user.

Industry-Specific Applications of Sales KPI Dashboards
- Retail: Track daily sales volume, customer footfall conversion, and seasonal trends.
- Technology: Monitor sales pipeline stages, lead quality, and product penetration.
- Services: Analyze client acquisition rates, contract renewals, and upsell success.
- Manufacturing: Focus on order fulfillment rates, sales cycles, and distributor performance.
Simple Sales KPI Dashboard Implementation Checklist
| Step | Action | Notes |
|---|---|---|
| 1 | Define Sales Objectives | Identify what the sales team aims to achieve in measurable terms. |
| 2 | Select Relevant KPIs | Choose indicators tightly linked with objectives to track performance accurately. |
| 3 | Choose Dashboard Template | Pick an Excel template that supports your KPIs and is easy to update. |
| 4 | Input Data | Gather clean, accurate sales data to feed into the dashboard. |
| 5 | Review and Customize Visuals | Adjust charts and tables for usability and focus. |
| 6 | Regular Monitoring | Update and analyze the dashboard regularly (weekly/monthly). |
| 7 | Make Informed Decisions | Use insights to optimize sales strategy and improve results. |
Additional Resources for Sales Success
To further enhance your sales effectiveness, explore comprehensive strategy packs that complement data insights with actionable techniques. Boost your business growth and customer retention using proven frameworks and automated tools available on our platform.
Explore our Sales Conversion Strategy Pack for focused methods to increase closing rates and Customer Retention and Loyalty Strategy Pack to maintain long-term client relationships.
For a complete approach to business growth, the Small Business Growth Strategy Pack offers valuable plans, including marketing, sales, and financial insights.
Start using a well-structured Sales KPI Dashboard Excel Template today to measure, track, and accelerate your sales performance efficiently.


