What Is Cost‑Benefit Analysis (CBA)?
A Cost‑Benefit Analysis (CBA) is a systematic process for evaluating the economic worth of a proposed project or decision. By translating both costs and benefits into a common monetary unit, CBA lets you compare alternatives and decide which option delivers the greatest net value.
Why Use a CBA?
- Objective decision‑making: Reduces bias by quantifying trade‑offs.
- Prioritises resources: Shows where limited funds generate the highest return.
- Supports stakeholders: Provides a clear, data‑driven rationale that can be shared with investors, managers, regulators or the public.
- Versatile applications: Works for public policy, health‑care budgeting, infrastructure, product launches, and everyday business choices.
Core Principles of a Good CBA
Follow these foundational rules to keep your analysis reliable and transparent.
- Define a clear study scope and time horizon.
- Use a single, comparable unit of measurement (usually dollars).
- Identify all relevant costs – capital, operating, externalities, and opportunity costs.
- Identify all relevant benefits – revenue gains, cost savings, social welfare, health outcomes, etc.
- Apply a with‑vs‑without comparison for each alternative.
- Avoid double‑counting of any cost or benefit.
- Choose a consistent discount rate to bring future values to present‑day terms.
- Document assumptions and data sources for auditability.
Step‑by‑Step CBA Recipe
- Define the objective: What decision are you trying to support?
- List alternatives: Usually a “do‑nothing” baseline plus one or more project options.
- Gather data: Estimate costs and benefits for each alternative. Use market prices, surveys, or published studies.
- Convert to present value: Apply a discount rate (e.g., 5‑7%).
- Calculate Net Present Value (NPV): NPV = Σ(Present‑value benefits) – Σ(Present‑value costs).
- Perform sensitivity analysis: Test how results change with different discount rates or key assumptions.
- Make a recommendation: Choose the alternative with the highest positive NPV or best benefit‑cost ratio.
Quick CBA Checklist
| Task | Completed? |
|---|---|
| Objective clearly stated | ☐ |
| All alternatives listed | ☐ |
| Data sources documented | ☐ |
| Costs and benefits monetised | ☐ |
| Discount rate applied | ☐ |
| NPV calculated for each option | ☐ |
| Sensitivity analysis performed | ☐ |
| Recommendation written | ☐ |
Free Excel Templates to Jump‑Start Your CBA
Save time and avoid calculation errors with ready‑made spreadsheets. Each template includes pre‑built formulas for discounting, NPV, and benefit‑cost ratios.
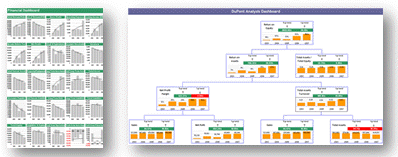
- Financial Dashboard Excel – A visual dashboard that tracks costs, revenues, and net value over time.
- Business Plan Template – Integrates CBA into overall strategic planning.
- Financial Statements Templates – Helps you pull in real financial data for a more accurate analysis.
Industry‑Specific CBA Examples
1. Government Policy Evaluation
When assessing a new transportation project, the analysis includes construction costs, vehicle operating costs, accident reduction benefits, and time‑saved for commuters. A benefit‑cost ratio >1 indicates a viable public investment.
2. Healthcare Funding Decisions
Hospitals use CBA to compare the rollout of a new tele‑medicine platform versus expanding physical clinic space. Benefits include patient‑time saved, reduced readmission rates, and lower overhead, while costs cover software licensing and training.
3. Small Business Marketing Campaign
A boutique retailer evaluates a $5,000 social‑media ad spend. Estimated benefits are incremental sales, customer acquisition cost, and lifetime value. A positive NPV justifies the spend and informs the optimal budget allocation.
Common Pitfalls & Pro Tips
- Ignoring non‑monetary benefits: Qualitative factors (brand reputation, employee morale) can be valued using proxy measures.
- Using outdated data: Verify that cost estimates reflect current market prices.
- Over‑optimistic discount rates: A higher rate lowers future benefits dramatically; test a range (3‑7%).
- Failing to conduct sensitivity testing: Identify which variables most affect your result and focus on refining those inputs.
Next Steps: Build Your Own CBA Workbook
Download the Excel templates above, fill in your project‑specific numbers, and use the checklist to validate each step. When you’re ready, share the results with stakeholders to secure approval.
Ready to supercharge your analysis?
Explore the Financial Dashboard Excel for a visual, real‑time view of costs, benefits, and net value. It’s the fastest way to turn raw data into actionable insight.