Introduction: Elevate Your Business Reporting with Effective Scorecards
In today’s competitive landscape, clear, visually compelling business scorecards are essential for strategic oversight and operational excellence. Whether you’re managing a global enterprise or a small startup, the ability to present critical metrics on a single, easy-to-understand dashboard empowers decision-makers at all levels.
This guide showcases a variety of business scorecard examples and templates. From executive dashboards to industry-specific applications, discover how to craft reports that boost performance tracking, facilitate quick insights, and support strategic growth.
Understanding the Core Elements of Business Scorecards
- Key Performance Indicators (KPIs): Quantifiable metrics that reflect strategic goals.
- Visual Indicators: Charts, gauges, traffic lights, and symbols that convey status at a glance.
- Tables & Data Visualizations: Organized data presentations for deep dives.
- Strategic Focus: Aligning metrics with business priorities across departments.
Here Are Some Proven Business Scorecard Examples
Executive Business Scorecard
This comprehensive dashboard offers a high-level overview of organizational performance across departments, sites, and regions. It consolidates critical KPIs into a visually appealing format, making it easy for senior management to identify trends and root causes quickly.
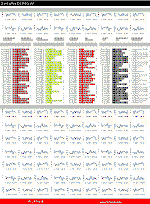
Benefits include:
- All key metrics on one page for quick review
- Effective visualizations for trend analysis
- Instant insights into business health
Learn how to design a similar dashboard using tailored templates. Explore options to create an executive scorecard for your organization and enhance your strategic decision-making processes.
Discover more about executive performance dashboards and start building your own with our customizable scorecard templates. Check out our resource for business performance tools.
Quality Management Scorecard
For manufacturing or service industries, quality scorecards track critical quality KPIs across multiple facilities. This example shows a scorecard developed for a Six Sigma program, aligning metrics across three production sites to monitor, benchmark, and improve quality levels daily, weekly, and monthly.
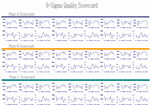
Key advantages:
- Standardized metrics across locations
- Real-time reporting for quick corrective actions
- Historical trend tracking for continuous improvement
Create your own quality scorecard to monitor multiple facilities seamlessly. Use our ready-to-go templates to streamline your reporting process and support your Six Sigma initiatives.
Sales Scorecard
This monthly sales report consolidates hundreds of metrics into a single-page view. It includes trend charts covering a 13-month period, top ten rankings, and performance indicators for sales and marketing efforts. Visual cues highlight declines or improvements for quick assessment.
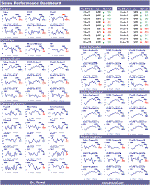
Benefits include:
- Time-saving reporting process
- Clear visual presentation of sales trends
- Facilitates productive, data-driven sales meetings
Transform your sales data into actionable insights using our customizable templates and dashboards. Enhance your sales performance management with tools that are designed for busy professionals.
Production Scorecard
This scorecard helps production managers keep tabs on costs, inventory, throughput, safety, quality, and other critical metrics. Designed for daily use, it offers real-time insights into plant performance, helping to streamline operations and make quick adjustments.
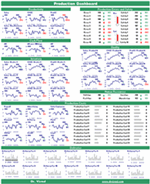
Advantages:
- All production KPIs on a single page
- Timely updates for immediate decision-making
- Supports continuous process improvement
Start compiling your own comprehensive production scorecard today. Use our templates to monitor key operational metrics efficiently and improve your bottom line.
Expanding Your Business Scorecard Toolkit
Depending on your industry, you might tailor scorecards specifically to track:
- Customer satisfaction and experience (e.g., service industries)
- Financial health and profitability (e.g., retail, finance)
- Supply chain efficiency (e.g., logistics firms)
Our customizable templates support all these needs, enabling you to develop industry-specific dashboards quickly.
How to Develop Your Business Scorecard Step-by-Step
- Identify core KPIs: Select metrics that truly reflect your strategic goals.
- Gather data sources: Connect or import data from systems or spreadsheets.
- Design visualizations: Use charts, symbols, and color codes for clarity.
- Create layout: Organize KPI visuals logically for quick insights.
- Automate updates: Link data sources for real-time or regular refreshes.
- Share and review: Distribute dashboards and gather feedback for improvements.
Use dedicated Excel templates and tools to simplify this process. For example, explore our automated Excel reporting tools to streamline your scorecard creation.
Tools & Resources to Get Started Quickly
| Step | Action Item | Suggested Tool |
|---|---|---|
| 1 | Define KPIs and metrics | Business KPI Templates |
| 2 | Gather data sources | Excel Data Connection Templates |
| 3 | Design visualizations | Weighted Scorecard Layouts |
| 4 | Automate updates | Automated Excel Reporting |
| 5 | Share dashboards | Online Sharing Platforms or PDFs |
Want to expedite your scorecard development? Check out our workflow automation tools.
Final Takeaway
Developing impactful business scorecards is a strategic skill that enhances organizational transparency, accountability, and decision-making. Use these examples, tools, and steps as a foundation to craft your own tailored dashboards.
If you’d like ready-made, customizable templates to streamline this process, explore our extensive library of templates and optimize your business reporting today with the automated Excel reporting platform.


