Proven Strategies to Choose the Best Model for Sales Prediction Accuracy

Predicting sales targets from a complex dataset can seem daunting. With many variables like branch names, product categories, and sales figures, selecting the right model is critical for accurate forecasts. In the FMCG industry, accurate sales prediction drives inventory planning, staffing, and revenue growth. But how do you choose the best model for your dataset? … Read more

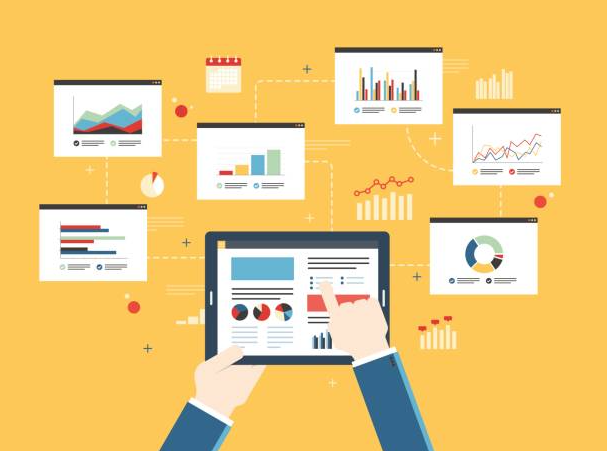
Creating a Dashboard in Excel: Step-by-Step Guide for Business Managers

Creating a Dashboard in Excel: Step-by-Step Guide for Business Managers

Table of Contents Introduction: Why Excel Dashboards Matter for Business Step 1: Plan Your Excel Dashboard Step 2: Prepare Your Data Step 3: Create Data Visualizations Step 4: Build the Dashboard Layout Step 5: Add Interactive Elements Step 6: Connect Data with Formulas and Functions Industry-Specific Examples Conclusion: Key Takeaways Introduction: Why Excel Dashboards Matter … Read more

KPIs And Metrics Reporting Systems

Understanding KPIs and Metrics Reporting Systems for Business Success In today’s competitive landscape, tracking performance through effective reporting systems is fundamental. Implementing robust KPI (Key Performance Indicator) reporting can guide strategic decisions, optimize operations, and foster a culture of continuous improvement. Why Establish KPI Reporting Systems? Align business goals: Clear KPIs connect daily activities with … Read more

Excel KPI Dashboard: Free Templates, Tools, and Strategies

What is an Excel KPI Dashboard? An Excel KPI dashboard is a visual reporting tool that displays key performance indicators in an organized, easy-to-read format. These dashboards transform raw data into actionable insights, helping businesses track progress toward strategic objectives. Excel dashboards are particularly valuable for HR professionals who need to monitor workforce metrics, track … Read more

Warehouse KPI Template Excel: Free Checklist for Boosting Growth

Why Warehouse KPIs Matter for Business Growth Warehouse operations directly impact your bottom line. Poor inventory management costs businesses an average of 25% in lost revenue annually. Key performance indicators help you: Reduce operational costs by 15-30% Improve order accuracy rates Boost customer satisfaction scores Streamline supply chain efficiency Essential Warehouse KPIs Every Business Should … Read more

The Best Help to Using Excel for Business

Introduction – Excel as a Business Powerhouse Excel is more than a spreadsheet—it’s a flexible, low‑cost platform for reporting, analysis, and automation. Whether you are building a sales dashboard, tracking expenses, or creating a financial model, the right Excel techniques can save hours and improve accuracy. Why Use Ready‑Made Excel Templates? Templates give you a … Read more

How to Produce a Dashboard in Excel [Templates]

Why Build a Dashboard in Excel? Excel is already part of most business workflows, making it a low‑cost, familiar platform for visualising KPIs, metrics and real‑time performance. A well‑designed dashboard gives you: Instant visibility of critical data at a glance Alignment across teams with a single source of truth Faster decision‑making based on up‑to‑date numbers … Read more