Understanding Break Even Analysis
Break Even Analysis is a vital financial tool for any business. It helps identify the point at which total revenue equals total costs, signaling zero profit or loss. This analysis assists in decision-making related to pricing, sales targets, and cost management.
Key Components of Break Even Analysis
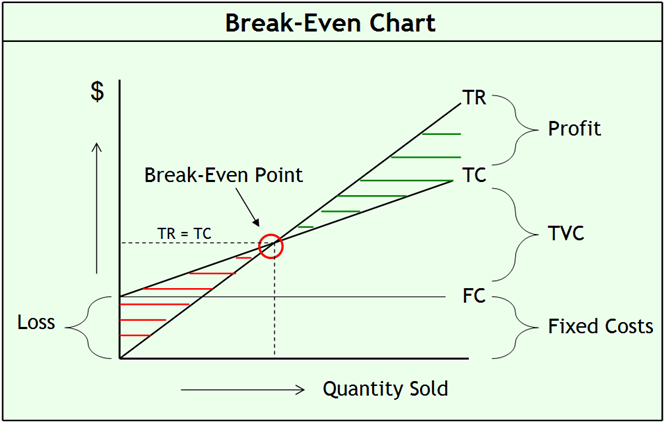
- Total Revenue (TR): Calculated as the number of products sold multiplied by the unit price.
- Total Fixed Costs (TFC): Costs that do not change with the level of production or sales, such as rent, salaries, and insurance.
- Total Variable Costs (TVC): Costs that vary directly with the number of units produced or sold, such as raw materials and direct labor.
Break Even Formula
The basic formula to calculate profit (P) is:
P = TR – TC
Where:
- TR = Unit Price × Units Sold
- TC = TFC + TVC (Total Cost)
Calculating the Break Even Point (Units)
The Break Even Point (BEP) in units shows how many units a company must sell to cover all fixed and variable costs:
BEP (units) = Total Fixed Costs ÷ (Unit Price – Variable Cost per Unit)
Calculating the Break Even Revenue
This indicates the total sales revenue needed to break even:
BEP (revenue) = BEP (units) × Unit Price
Break Even Analysis in Excel: Template and Chart
Using Excel to perform break even analysis offers an interactive way to visualize how sales, costs, and profits relate.
- The template calculates key values automatically when you input fixed costs, variable costs per unit, and unit price.
- A dynamic break-even chart displays revenue and cost curves, highlighting the break even point and helping you understand the impact of +/- 50% revenue variation.
How to Use the Excel Break Even Template
- Input your total fixed costs in the designated cell.
- Enter the variable cost per unit and the unit selling price.
- The calculator will provide the break even units and revenue automatically.
- Review the break-even chart to understand how changes in sales volumes affect profitability.
Industry-Specific Examples of Break Even Analysis
Retail Business
For retail businesses, break even analysis helps determine the minimum sales needed to cover rent, salaries, and cost of goods sold. It informs discount decisions and inventory management.
Manufacturing
Manufacturers use break even points to evaluate production levels that justify equipment or labor investments, especially when balancing fixed costs with large variable cost components.
Service Industry
Service providers apply break even analysis to price their offerings correctly, considering fixed overheads such as office rent and salaries with variable costs like subcontracted labor.
Tips for Effective Break Even Analysis
- Regularly update fixed and variable costs to reflect current market conditions.
- Use break even analysis in combination with other financial tools like cash flow forecasting.
- Analyze sensitivity by varying assumptions on price or cost to understand risk.
- Incorporate seasonal or cyclical sales variations for more accurate planning.
Step-by-Step Break Even Analysis Checklist
| Step | Action | Example |
|---|---|---|
| 1 | Identify Total Fixed Costs (TFC) | Rent = $3,000/month |
| 2 | Determine Variable Cost per Unit (VC) | Material + labor = $7/unit |
| 3 | Set Unit Selling Price (UP) | $15/unit |
| 4 | Calculate Contribution Margin (UP – VC) | $15 – $7 = $8 |
| 5 | Compute Break Even Units (TFC ÷ Contribution Margin) | $3,000 ÷ $8 = 375 units |
| 6 | Calculate Break Even Revenue (Units × UP) | 375 × $15 = $5,625 |
| 7 | Validate results with chart or Excel model | Use the provided break-even chart to visualize |
Additional Resources to Improve Financial Planning
- Explore advanced pricing and profitability strategies to maximize revenue and profit margins with proven frameworks available here.
- Leverage automated Excel financial reporting templates to track performance and cash flow after your break even point is reached. View templates here.
- Develop a comprehensive financial plan incorporating break even analysis with this financial business plan Excel template.
Break Even Analysis is foundational to profitable business management. Use the formula, examples, and Excel template here to make informed, data-driven decisions that guide your business toward sustained success.


