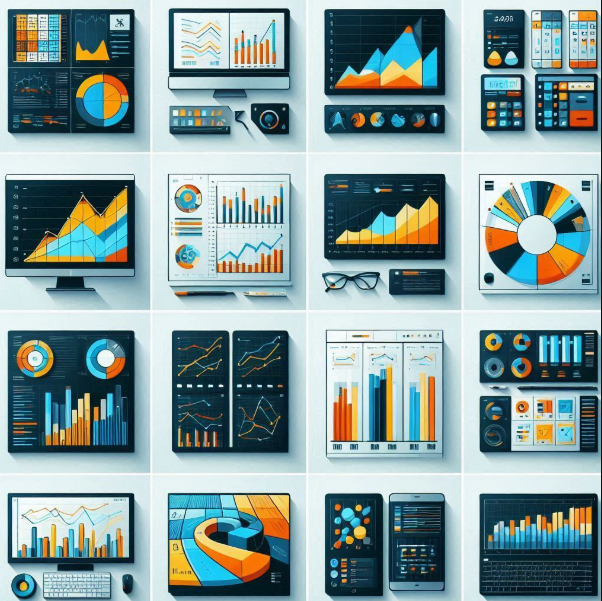
Presenting raw data in its native form can be overwhelming and often obscures insights. Instead, leveraging the right Excel charts transforms data into clear, actionable visuals. Well-chosen charts help you identify trends, uncover patterns, and explore relationships that might stay hidden in spreadsheets. This makes your dashboards not only more appealing but also more powerful decision-making tools.
Why Visual Charts Power Up Your Excel Dashboard
- Simplify Complex Data: Visuals distill large datasets into understandable stories, quickening analysis.
- Enhance Communication: Charts convey insights more effectively than numbers alone — ideal for presentations and reports.
- Drive Data-Driven Decisions: Visual trends and comparisons empower smarter choices and strategic planning.
Choosing the Ideal Excel Chart Type for Your Data
Excel offers a variety of chart types, each suited for specific data insights. Here’s a detailed guide to help you pick the right one:
1. Line Charts: Visualize Trends and Patterns Over Time
- Best for tracking sales, revenue, or user engagement across periods.
- Ideal for spotting seasonal fluctuations or long-term growth.
- Example: Monthly sales reports for a retail store.
2. Bar Charts: Compare Categories and Grouped Data
- Excellent for comparing sales, customer responses, or expenses among different categories.
- Useful for visualizing data across regions, departments, or product lines.
- Example: Marketing campaign effectiveness across platforms.
- Great for illustrating parts of a whole — market share, budget allocations, or customer segments.
- Effective when there are limited categories and clear differences.
- Example: Breakdown of revenue by product category.
4. Scatter Plots: Explore Relationships Between Variables
- Perfect for analyzing correlations like price vs. sales volume or advertising spend vs. customer acquisition.
- Useful in forecasting and identifying outliers.
- Example: Relationship between employee training hours and productivity.
5. Area Charts: Emphasize Volume and Cumulative Trends
- Show how different data series contribute to a total over time.
- Great for visualizing cumulative sales, market growth, or resource utilization.
- Example: Comparing sales contributions of multiple product lines over a year.
6. Combination Charts: Convey Multi-Daceted Insights
- Merge different chart types like line and bar to tell comprehensive stories.
- Use dual axes for different metrics with distinct scales.
- Example: Visualizing revenue growth alongside profit margins.
Advanced Techniques for Impactful Excel Charts
Beyond basic chart types, smarter customization and interactive features elevate your dashboard:
1. Customizing for Clarity and Appeal
- Color Coding: Use consistent colors to differentiate data series or categories, aiding quick recognition.
- Data Labels: Add labels for exact values or percentages to improve comprehension.
- Legends and Gridlines: Enhance readability with clear labels and subtle gridlines.
2. Creating Interactive Excel Charts
- Incorporate slicers and filters for dynamic data exploration.
- Use hover tooltips to show additional details.
- Enable drill-down features for detailed views on demand.
3. Incorporating Real-Time Data Updates
- Connect charts to external data sources for live visualizations.
- Automate updates to keep your dashboard current — critical for real-time monitoring like sales, stock prices, or social media metrics.
- Automated Excel reporting tools can simplify real-time data refreshes and enhance your dashboard’s responsiveness.
Best Practices for Effective Data Visualization in Excel
- Simplicity First: Avoid clutter. Focus on key insights.
- Choose Correct Chart Types: Match your data story with the appropriate visualization.
- Clear Labels: Ensure axes, data points, and legends are easy to read.
- Strategic Use of Color: Highlight critical data — avoid unnecessary color variations.
- Scale Properly: Be cautious with axes to prevent misleading impressions.
Industry-Specific Cases: Tailoring Charts to Your Business
Retail Business: Tracking Seasonal Sales & Inventory
- Use line charts to visualize sales trends over months.
- Bar charts compare product sales across categories.
- Pie charts show market share among top brands.
- Scatter plots analyze price versus sales for promotions.
Service Sector: Monitoring Customer Satisfaction & Feedback
- Use bar charts for survey scores in different regions.
- Pie charts visualize customer demographics.
- Area charts show cumulative service requests over time.
- Combination charts mix customer feedback scores with response times.
Tech & SaaS: Analyzing User Engagement & Churn Rates
- Line and area charts track user activity patterns.
- Scatter plots find relationships between engagement metrics and customer retention.
- Dashboards could combine these with real-time data feeds.
How to Implement and Optimize Your Excel Dashboard Using Visuals
Here’s a simple table to help you plan your dashboard visualization:
| Data Type | Best Chart Type | Purpose | Example |
|---|---|---|---|
| Trends Over Time | Line Chart | Monitor growth, fluctuations | Monthly sales |
| Category Comparison | Bar Chart | Compare groups | Sales by region |
| Proportions | Pie Chart | Market split, budget sharing | Revenue by product |
| Relationships | Scatter Plot | Analyze correlations | Price vs. units sold |
| Cumulative Data | Area Chart | Show totals, contribution | Quarterly revenue |
For creating impactful dashboards, consider exploring platforms that support real-time data updates and interactive charts. See how automated excel reporting can streamline your workflow.
Remember, effective dashboard visualization combines clear data insights with strategic chart choices and customization. These techniques enable you to craft dashboards that support rapid and informed decisions — whether for sales, marketing, finance, or operations.
Start enhancing your dashboards today by exploring our collection of templates and tools that streamline data visualization. Here’s a comprehensive financial dashboard Excel template designed for high-impact reporting.
Summary: Building Your Data Visualization Skillset
- Identify the key story in your data.
- Select the appropriate chart type for your insight.
- Customize for clarity and engagement.
- Leverage interactivity and real-time data where applicable.
- Follow best practices for visualization effectiveness.
Combining these steps ensures your Excel dashboards become vital decision-making tools, giving your business the edge it needs to thrive in a competitive market.
Explore more resources like the financial statements templates or marketing plan templates to support your data-driven strategies.


