Introduction
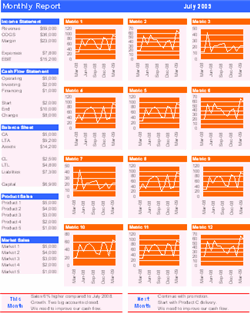
A business dashboard is more than a pretty set of charts. It is a central, visual hub that translates complex data into clear, actionable insight. By bringing key performance indicators (KPIs) and strategic goals onto a single screen, a dashboard helps leaders make faster, smarter decisions.
Why Use a Business Dashboard?
Modern organizations face a flood of data from sales, finance, operations, and marketing. Without a cohesive view, critical signals get lost. A well‑designed dashboard solves three core problems:
- Speed: Real‑time data eliminates the lag of manual reporting.
- Clarity: Visual cues (bars, gauges, heat maps) make trends obvious at a glance.
- Alignment: Everyone sees the same metrics, ensuring teams work toward shared goals.
Core Benefits of a Business Dashboard
Below are the most impactful advantages for any size business.
- Instant performance monitoring – Spot dips or spikes before they become problems.
- Data‑driven decision making – Base every strategic move on factual insight.
- Improved communication – Share a single visual story with executives, managers, and staff.
- Risk identification – Early alerts highlight threats, opportunities, and emerging trends.
- Time savings – Replace endless spreadsheet shuffling with a single, interactive view.
- Strategic alignment – Bridge the gap between corporate strategy and day‑to‑day operations.
Industry‑Specific Examples
Retail
Track sales per square foot, inventory turnover, and customer footfall in one view. Quickly re‑stock fast‑moving items and adjust promotions based on real‑time sales trends.
Manufacturing
Monitor production OEE (Overall Equipment Effectiveness), scrap rates, and lead times. A dashboard highlights bottlenecks, enabling lean‑process improvements.
Professional Services
Show billable utilization, project profitability, and pipeline health. Managers can allocate resources before projects become over‑committed.
How to Build an Effective Business Dashboard
Follow this “recipe‑style” guide to create a dashboard that delivers results.
- Define the purpose – Are you monitoring daily operations, quarterly strategy, or executive KPIs?
- Select the right metrics – Limit to 5‑7 high‑impact KPIs that directly reflect your objectives.
- Choose visual types – Use line charts for trends, gauges for thresholds, and bar charts for comparisons.
- Consolidate data sources – Pull from ERP, CRM, and finance systems into a single data model.
- Design for readability – Keep layout clean, use consistent colors, and add simple legends.
- Set up alerts – Configure conditional formatting or email triggers for KPI deviations.
- Test with end‑users – Gather feedback, refine visuals, and ensure the dashboard answers real questions.
Need a ready‑made template? Check out our Financial Dashboard Excel template to jump‑start your design.
Dashboard Design Tips
- One screen, one story: Avoid scrolling; keep the most critical data on the primary view.
- Use color purposefully: Green for good, red for warning, neutral tones for baseline data.
- Include context: Show previous period or target lines next to current values.
- Make it interactive: Enable drill‑down filters so users can explore deeper layers.
Quick Implementation Checklist
| Task | Completed? | Notes |
|---|---|---|
| Identify 5‑7 core KPIs | ☐ | Link each KPI to a data source. |
| Choose visualization types | ☐ | Line, bar, gauge, heat map. |
| Build data connections | ☐ | Use Excel, Power Query, or your BI tool. |
| Apply conditional formatting | ☐ | Set red alerts for KPI < 80% of target. |
| Test with stakeholders | ☐ | Collect feedback, iterate. |
Additional Resources
Boost your dashboard strategy with these complementary tools:
- Balanced Scorecard and Strategy Map Toolkit – Align KPIs with long‑term objectives.
- One‑Page Executive Excel Report Template – Summarize dashboard insights for leadership meetings.
- Excel Long‑Tail Keywords Generator – Discover SEO keywords for your dashboard documentation.
Final Thoughts
A business dashboard turns raw data into a strategic advantage. By focusing on the right metrics, using clear visual designs, and embedding alerts, you enable your team to react quickly and stay aligned with corporate goals.
Ready to implement a powerful, ready‑to‑use solution? Explore the Financial Dashboard Excel template and start visualizing performance today.


