Understanding the Balanced Scorecard
The Balanced Scorecard is a powerful tool for organizations to monitor performance against strategic goals. Its objective is to improve overall performance by focusing on metrics that significantly impact the organization. It provides a comprehensive view by incorporating various perspectives of performance.
Why Use Balanced Scorecard Key Performance Indicators?
Key Performance Indicators (KPIs) allow your organization to set measurable targets across different areas of performance. Implementing a balanced scorecard complements this by helping visualize data and results, making it easier to communicate with your team. By aligning KPIs with four primary perspectives, organizations can obtain a holistic view of their operational effectiveness.
Four Perspectives of the Balanced Scorecard
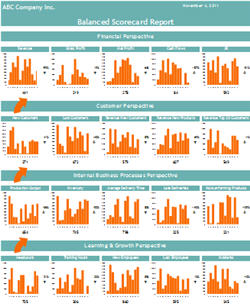
The Balanced Scorecard analyzes performance through four crucial perspectives:
1. Financial Perspective
- Track your organization’s financial performance.
- Indicators might include revenue growth, profitability, and return on investment.
2. Customer Perspective
- Understand customer satisfaction, retention, and acquisition rates.
- Key metrics could be Net Promoter Score (NPS), customer lifetime value, and market share.
3. Internal Process Perspective
- Set objectives for internal operations to meet company goals.
- Focus on metrics such as process efficiency, quality control, and cycle time reduction.
4. Learning and Growth Perspective
- Invest in employee training and innovation.
- Metrics may include employee engagement scores, training hours per employee, and innovation rate.
Examples of Balanced Scorecard Key Performance Indicators
Here are specific KPIs you might consider for each perspective:
Financial Indicators
- Increase market share by 10% within 12 months.
- Reduce total expenses by 5% within 3 years.
- Boost sales by 5% within 7 months.
- Raise $20 million in investments over the next year.
Customer Indicators
- Enhance customer retention rate by 10% over the next year.
- Turn 10% of customers into lifetime clients within 12 months.
- Improve customer satisfaction score by 15% in 18 months.
Internal Process Indicators
- Reduce manufacturing cycle time by 10% within 3 months.
- Enhance workforce productivity by 10% within 18 months.
Learning and Growth Indicators
- Invest 5% of profits into employee development annually.
- Achieve 90% of new innovations patented within 9 months.
Create Balanced Scorecard Key Performance Indicators Reports Using Excel Templates
You can leverage Excel templates for easily creating and monitoring Balanced Scorecard reports. These templates enable you to visualize KPIs and track performance over time.
Implementing Your Balanced Scorecard
To implement your Balanced Scorecard approach effectively, follow these steps:
- Identify Your Goals: Align your organizational goals with the KPI perspectives.
- Select Relevant KPIs: Choose KPIs that accurately reflect your goals.
- Visualize the Data: Utilize tools like Excel to create visual dashboards.
- Monitor and Report: Regularly review performance data and adjust strategies accordingly.
Tools and Examples
Consider the following tools for monitoring and reporting:
- Microsoft Excel Templates for Balanced Scorecard reporting.
- Online dashboards for real-time KPI tracking.
Conclusion
Implementing Balanced Scorecard KPIs can significantly enhance your organization’s strategic alignment and performance management. Remember to select measurable and attainable indicators specifically suited to your business objectives.
Discover more about managing your performance metrics effectively with our Balanced Scorecard toolkit to access templates and resources that can help you implement these strategies effectively.


