Executive Summary
The asset turnover ratio reveals how well your business converts assets into revenue. This metric helps identify inefficiencies in resource use and guides smarter investment decisions. Learn how to calculate it, interpret results, and improve operations using real-world examples.
What Is Asset Turnover Ratio?
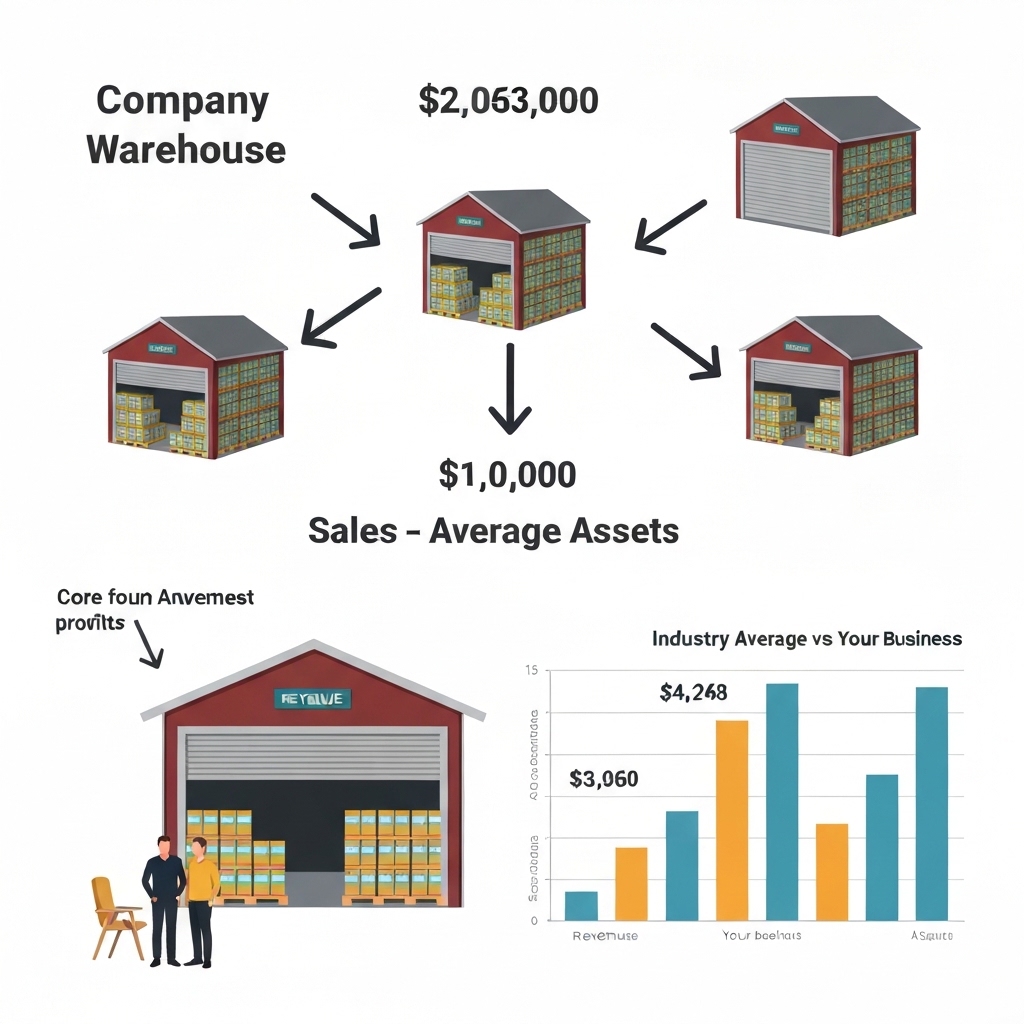
This ratio measures how efficiently a company generates sales from its assets. High ratios mean better performance – low ratios signal wasted resources. The formula: Total Sales ÷ Average Total Assets. For example, $2M in sales ÷ $1M average assets = 2.0 asset turnover ratio.
Why This Metric Matters
Businesses waste 20-30% of operational budgets through poor asset management (McKinsey study). Tracking this ratio highlights:
- Underperforming departments
- Excess inventory issues
- Underused equipment
- Opportunities for automation
How to Calculate Step-by-Step
1. Find Total Sales – Use annual revenue from your income statement.
2. Calculate Average Total Assets – (Beginning Assets + Ending Assets) ÷ 2
3. Divide Sales by Assets – Result shows dollars earned per asset dollar.
Example: Retailer with $5M sales and average assets of $2.5M has a 2.0 ratio – meaning $2 revenue for every $1 of assets.
Industry Benchmarks
Good ratios vary by sector:
- Retail: 2.5+
- Manufacturing: 0.75-1.25
- Software: 5.0+
A ratio below industry average means you’re spending more than competitors to make the same money.
Things to Remember
• Compare year-over-year trends, not single snapshots
• Seasonal businesses need quarterly tracking
• Physical assets-heavy industries naturally have lower ratios
• Sudden drops often signal inventory or equipment problems
Common Mistakes to Avoid
Mistake: Using total assets instead of average assets
Fix: Always average beginning/end balances
Mistake: Ignoring asset quality
Fix: Pair with fixed asset turnover ratio
Action Plan: Improve Your Ratio
- Inventory Audit: Sell obsolete stock, reduce safety stock levels
- Equipment Review: Lease underused machinery, sell idle assets
- Process Automation: Use RPA to cut labor costs in repetitive tasks
- Dashboard Setup: Track ratio monthly with alerts for 10%+ changes
Real-World Example
A logistics company had a 0.8 ratio vs 1.2 industry average. After analyzing:
- Sold 3 old trucks (reduced assets by $150K)
- Implemented route optimization software (boosted sales by $200K)
- New ratio: 1.15 within 6 months
Connecting to Business Dashboards
Automate ratio tracking with tools that connect to QuickBooks/Xero. Create alerts when:
- Ratio drops below industry benchmark
- Monthly change exceeds 5%
- Asset base grows faster than sales
Visualize trends with dual-axis charts showing sales vs asset growth.
What’s Next?
1. Calculate your current ratio using last quarter’s financials
2. Compare with industry data from your trade association
3. Identify top 3 asset inefficiencies
4. Schedule weekly progress checks on fixes
Small improvements compound: A 0.1 ratio increase can boost annual profits by 5-8% through better asset use alone.


